Line Chart
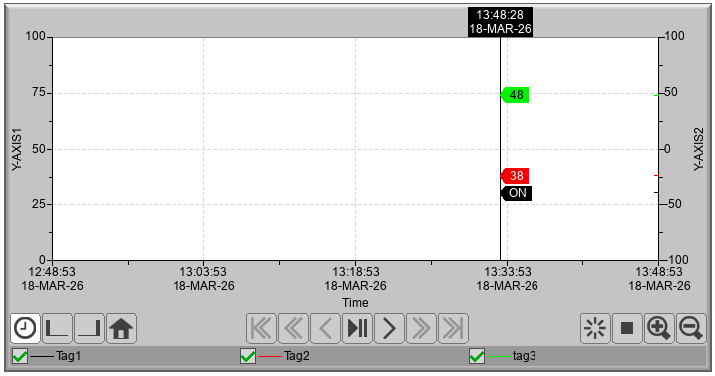
Plot 16 numeric values on a point or time basis. These values can be Integer, Float, or Discrete. Scroll, zoom, and analyze data in real time or from stored logs.
General Settings
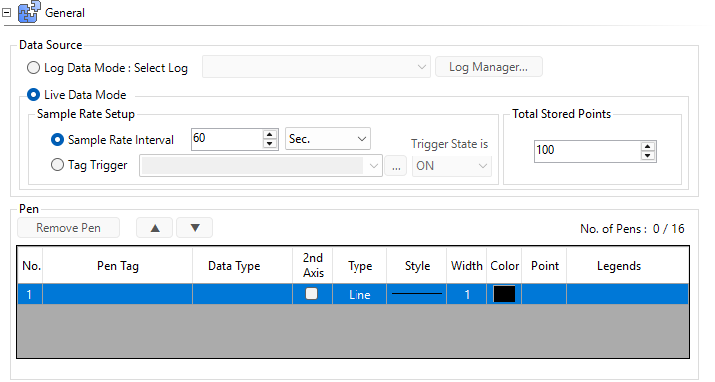
Select source data with Log Data Mode or Live Data Mode.
Log Data Mode
Log Data mode plots data saved in a Log created in Log Data.
Create a Log file then select that log as the trend source. Sample rates and the number of saved data points are part of the Log file configuration. See Log Data.
| Note: | If you add pens in Live Data Mode and change the chart to Log Data Mode, the configured pens create a new Log Manager file. |
Live Data Mode
Plot data stored in the panel memory. Select tags and configure the trend. This does not store the data as a log file.
Sample Rate Interval
Capture and plot each Pen Tag at a fixed interval, such as every 60 seconds. Configure it to run as fast as once per second.
Tag Trigger
Capture and plot each pen on the trigger tag rising or falling edge.
| Note: | You can set Trigger tags faster than once per second, but data capture is not guaranteed. Faster rates may cause performance issues in the panel since this can consume significant memory. Use fast sample rates with fewer tags when possible. |
Total Stored Points
A chart can store more data points than the screen displays so the operator sees a chart with good resolution with scroll back to make the chart wider than can fit on one screen.
The maximum is 65535 points. Each point uses memory in the panel run time. Set this number to a reasonable number of scroll back points. For higher points, use Log Data Mode.
If the total stored points is fewer than the X-axis can display, the line does not fill the chart area.
Pen Configuration
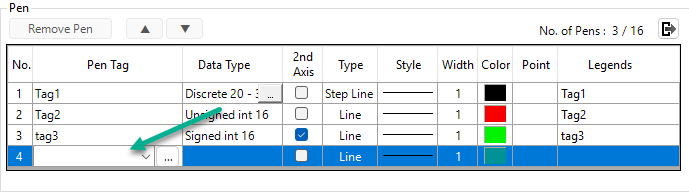
Each Pen is a tag which contains numeric information.
Click the table under Pen Tag and select a tag to chart.
Data Type
Data Type auto-fills based on the Pen Tag data type.
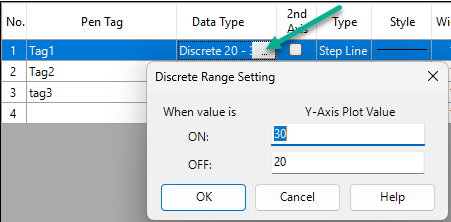
Discrete tags
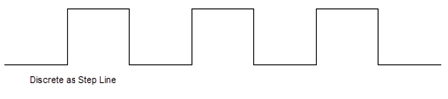
If the data type is Discrete, there is an option to set the On/Off values. You can position the step line anywhere in the chart area, as not to affect other pen scaling.
Type
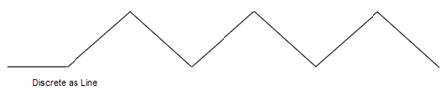
You can display Integer and Floating-Point data as Line or Step Line format.
Line
Step Line
2nd Axis
The line chart offers two distinct Y-axes. This allows data values to scale independently.
Legends
The Legend auto-populates to match the Pen Tag name. You can change the Legend to something more descriptive.
X-Axis Configuration
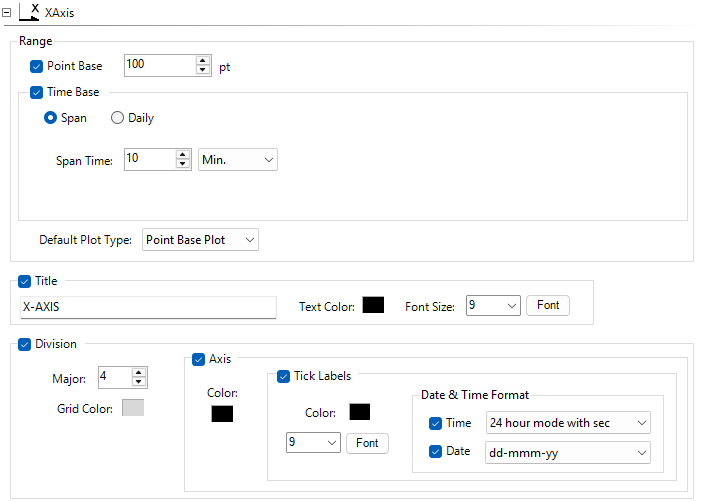
Range

Configure the X-Axis to display data by point number or by data capture time.
 Example:
In Trigger mode, the panel captures a point each time a machine cycle starts. In this case, point-based mode is more useful than displaying time. If the panel captures tank level every 5 minutes, time-based mode provides more meaningful context.
With both Point-Base and Time-Base, a clock icon appears below the chart. Use it to toggle between the two display modes.
Point Base
Set the number of data points to display across the width of the chart. This value must be lower than the Total Stored Points setting.
Time Base
Span: set the width of the chart in minutes, hours, or days.
Daily: display data for a period of 1-100 days in the past. Use this setting to compare current production data with the same period from a previous day or week.
Default Plot Type
When you select both Point- and Time-Base, you can choose which one the chart shows when the panel starts.
Y-Axis
Y-axis(1st): this sets the primary (left) Y-axis
Range Max/Min:
Auto
Calculates the highest current data set point on the grid and set the Y-axis 5% higher.
Static
Sets a fixed max or min Y-axis value.
Tag
The PLC sets the maximum Y-axis value. Use this to chart production data for products with different value ranges.
Y-Axis (2nd): this sets the secondary (right) Y-axis.
This section appears after you assign a pen to the second Y-axis. The settings are the same as the primary Y-axis.
Appearance
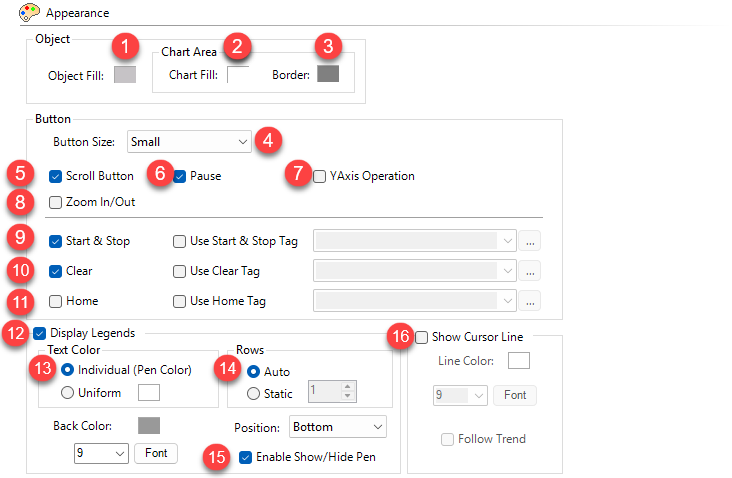
See these two images for numbered settings and explanations.
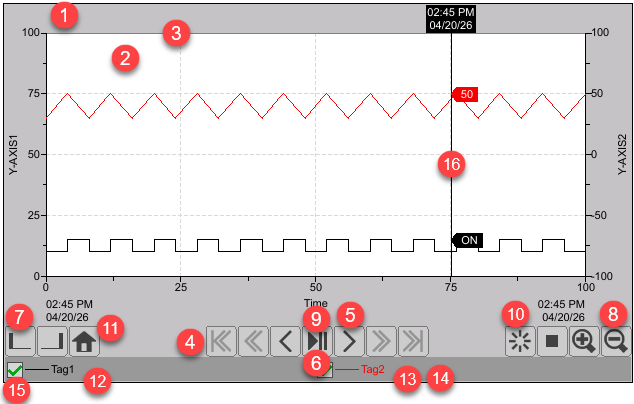
Button
4: Button Size
Change button size so buttons are clear on larger or smaller panels. Larger buttons have text labels.
5: Scroll Button
Enable the FW/RW buttons at the bottom of the chart to scroll back to see prior data and return to current data.
6: Zoom In/Out
Adds the magnifying glass icons to zoom the chart X-axis in/out to see data with more detail.
7: Pause
Stops updating the chart and holds it where it is. After you press Pause, press the button again to resume play.
8: Y-Axis Operation

Adds a button for each enabled object that opens Y-axis Scroll and zoom buttons. You can scroll or analyze more specific data.
9: Start and Stop
The Chart stops collecting data and restarts when you press again.
| Note: | Start and Stop is only available with Live Data Mode. Log Manager controls Log Data. |
10: Clear
Clears all data from the chart.
| Note: | Clear is on available with Live Data Mode. Log Manager controls Log Data. |
11: Home
Reset the chart to the configured view and scrolls to show the current data in real time, where you can scroll, zoom, and change the chart.
Use Tag
This allows your PLC to perform the same function as the button described above.
12: display Legends
Turns on a field at the bottom of the chart to display the pen name.
13: Pen Color
Set all Legend text to the same color or to automatically match the Pen color.
14: Rows
Names in the legend can auto-wrap, or you can specify pen number per line for better text spacing control.
15: enable Show/Hide Pen
Shows a tick box in the Legend beside each Pen to turn each line on/off on the graph so you can see Pens clearly and reduce clutter.
16: Show Cursor Line
Displays a line that shows each Pen value. Touch anywhere on the chart to see the data values at those locations.
Important Behaviors
Paused
-
Live Data Mode: data continues to accumulate. The graph jumps to real time when it restarts.
-
Log Data Mode: data continues to accumulate. The graph jumps to real time when it restarts.
Stopped
-
Live Data Mode: the panel stops gathering data. When it restarts, it charts the next point collected. This can result in a data lapse.
-
Log Data Mode: not available in Log Data Mode.
Power off
-
Live Data Mode: loses all data gathered while charting. The graph restarts blank.
-
Log Data Mode: behaves the same as when you press the stop button. No data logs while power is off, but when power is restored, charting continues uninterrupted.
Scrolling
-
Live Data Mode: the same as pause and move to display other data. The graph sits on the area where you scroll while the graph continues to collect data. When you return to current with the >>| or Home button, data displays up-to-date.
Behavior
For information on Press Delay and Release Delay, see Behavior.
CM244