|
|
Topic: P074 |
Data View |
|
|
|
Topic: P074 |
Data View |
|
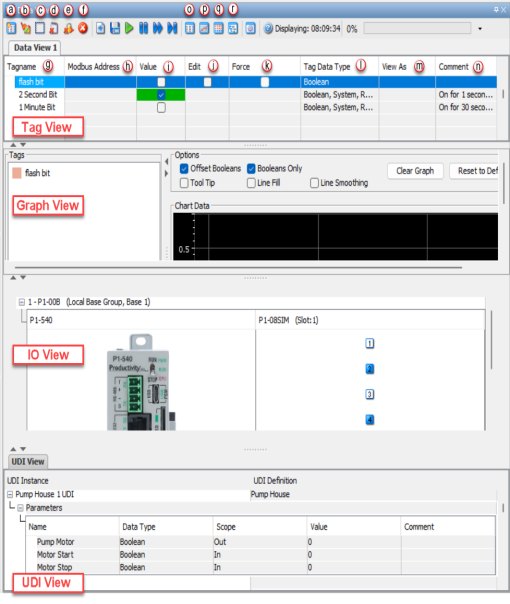
The Data View panel allows monitoring and manipulation of Tag values in the CPU. Tags created within your project will be shown. Multiple Data View tables (Tabs) can be created within a Data View window.
Note: You must be Online to monitor and edit values.
Note: Data view monitored values are updated at a 250 msec. rate.
There are three methods for accessing Data View.
Method 1
Select the Data View menu item from the Tools Menu dropdown of the Main Menu as shown here.
Method 2
Select Data View from the Monitor & Debug topics of the Application Tools panel as shown below.
Method 3
Select the Data View icon
from the Monitor Toolbar.
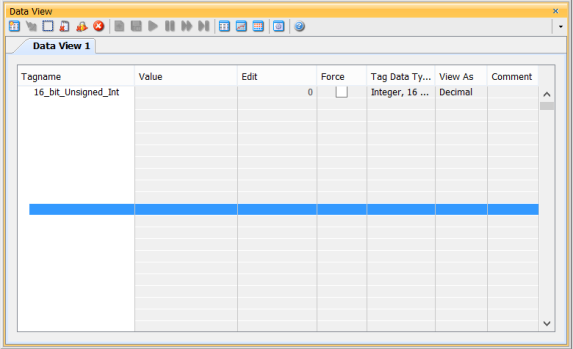
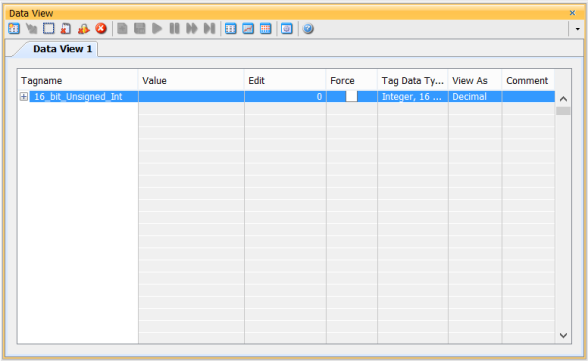
Once selected, a Data View window will open with the options shown below.
This section will discuss how to use Data View to view and edit tags. See the Graphing section below for information on the graphing functions available in this window.
Each Data View window provides the following:
Add Data View: Selecting this button will add another Data View Table.
Note: The Productivity CPU supports up to 64 Forceable Tags per project. Exceeding this number will cause an "There cannot be more than 64 Forceable Tags" Error.
There are three different types of views available in Data View for monitoring tag values. Each view can be toggled on or off independently. Tag View is the default. Each view that is toggled on is added to the left (if Splitpane Layout - Horizontal is selected) or to the bottom (if Splitpane Layout - Vertical is selected).
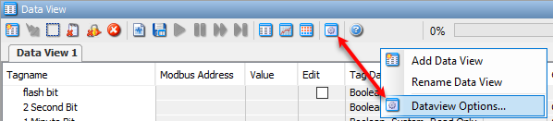
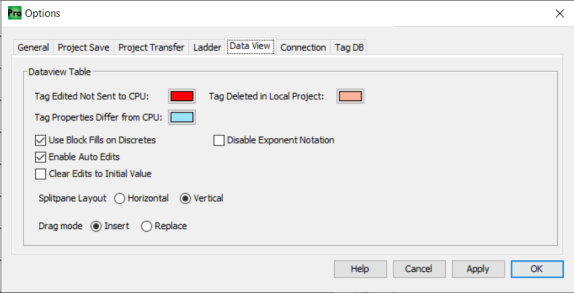
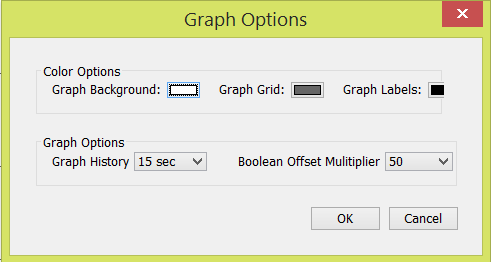
Various configuration options for
Data View can be accessed by
going to the Options tab of the Tools Menu (Tools > Options > Data
View). You can also get to the options by right clicking in the Data
View window and selecting
Data View option or by
selecting the Dataview Options icon in the toolbar.”
Integer tags can be viewed as Bit Of Word through Data View with the following steps:
Enter the integer tag you wish to view in the Data View Tagname field.
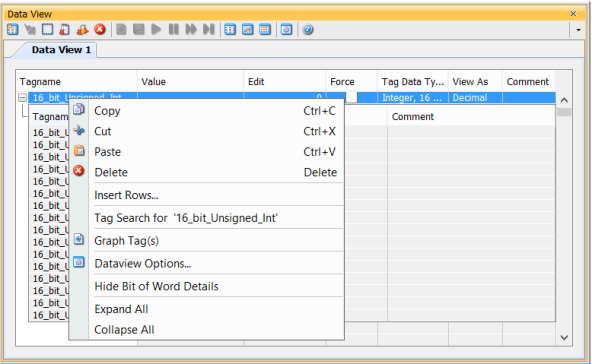
Right click on the tag and select
Show Bit Of Word Details.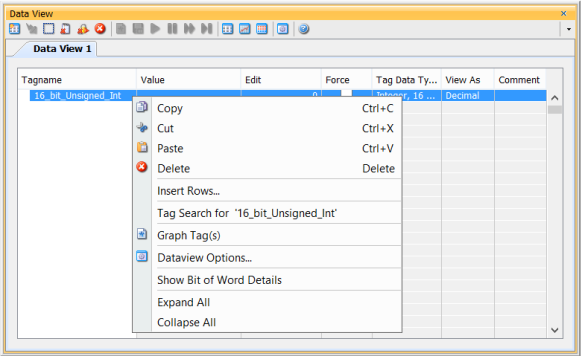
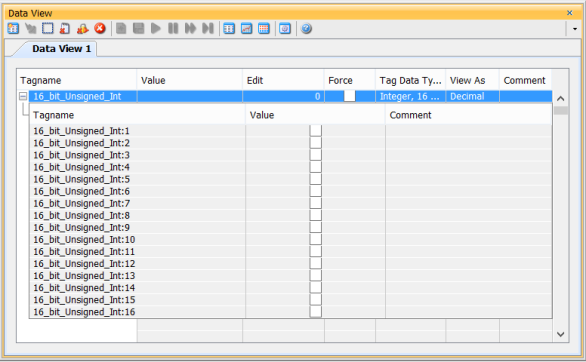
The tag will now show a "+" sign beside it. Left-clicking the "+"
sign expands the Integer into Bit Of Word.
The state of the bits of the integer can now be viewed.
Bit Of Word can be turned off by right-clicking on the tag again and selecting Hide Bit Of Word Details.
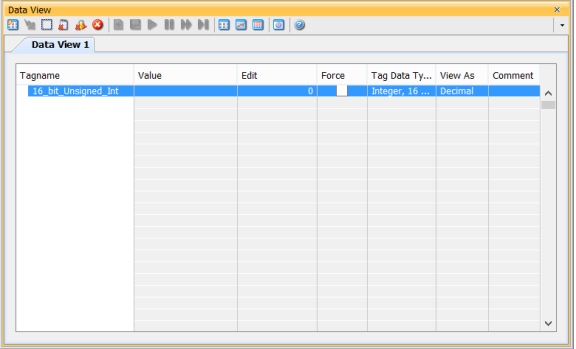
As mentioned above, tags can be added to the Data View window by clicking in the Tagname column and selecting a database tag from the list.
Note: The Bit of Word addressing format (Old_Version:1) is not allowed in the Data View window. To view bit level data, select the entire word and change the View As column to Binary.
Note: If you require Multiple tag inputs arranged in a table, once a desired tag is chosen for the first input field, leave the cursor in that field and select Ctrl+Enter.The remaining input fields will be populated with tags from the database in the order they appear after the initial tag.
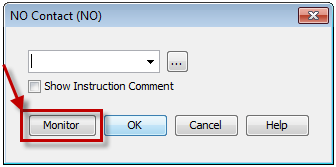
Tags can also be added from within each ladder instruction. A Monitor button is provided within each instruction (as seen below) which will add all tags associated with that instruction to the Data View window when selected.
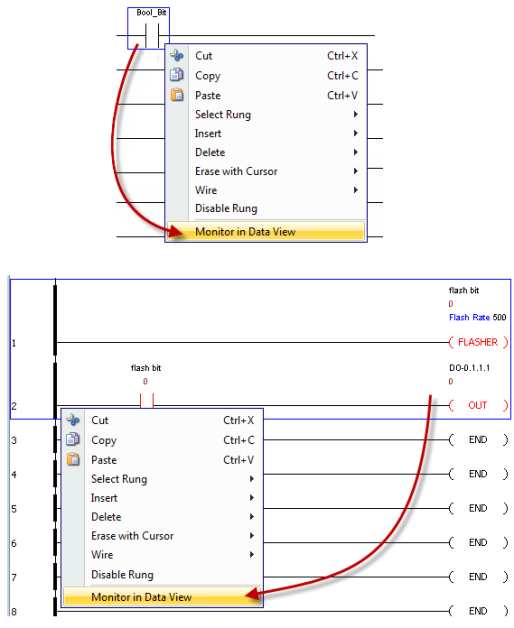
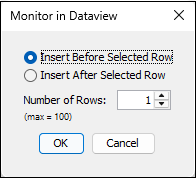
Adding tags from within the Ladder Editor can be done by right clicking the desired element, rung or rungs and selecting Monitor in Data View from the drop down menu.
After selecting to add tags from the instruction or Ladder Editor, a pop up will appear with two selections available for adding tags to Data View:
Create a new tab - This option will create a new tab in Data View that will contain the selected tag(s), enter a name for the new tab or leave the default.
Append to Existing Tab - This option allows the selected tag(s) to be added to an already existing tab in the Data View window.
These tags will be placed under a new Tab in the Data View that is named after the Task and Rung Location.
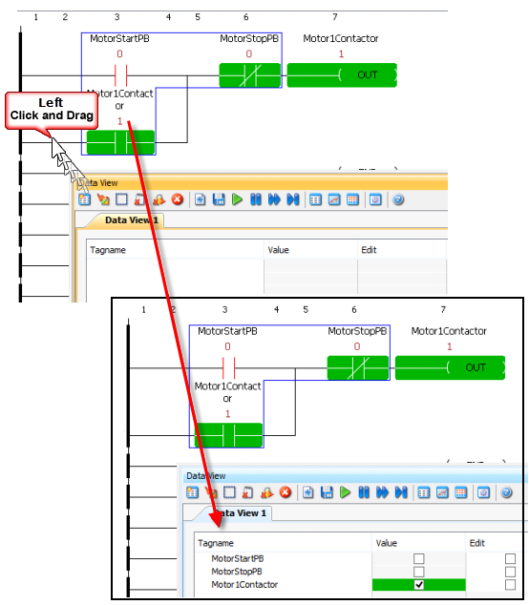
Another option is to highlight a ladder instruction(s) or entire rung(s) and drag them directly into DataVeiw adding all tags selected.
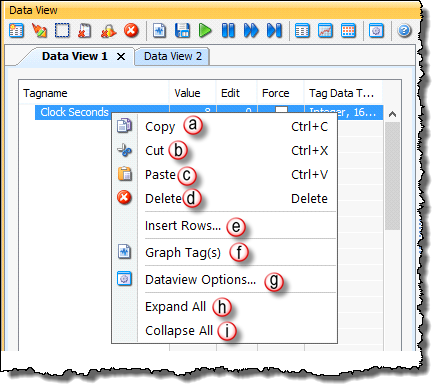
There are several options available from the Data View window once a tag(s) are added. To see the options available, right click on a tag(s).
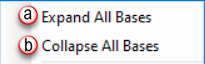
When selecting an Array or Structure Tag to monitor, the Data View window allows the user to expand or collapse the associated array elements. The user can display an entire array at once by clicking the "+" sign next to the array, as seen below:
Data View allows the use of Indirect Addressing when monitoring tag values. As seen in the example below, the index tag is the pointer or the tag that contains the element number desired and 1D Array Int 16 is the actual array. By placing index between the parenthesis in the array tag name (1D Array Int 16(index)), the array element is indirectly selected using the value of index. So if index = 1 (as seen in example), the element selected is 1D Array Int 16(1). If index = 2, the element selected is 1D Array Int 16(2). Any edits made to the array element must be done to the element tag (1D Array Int 16(1)) and not the indirectly addressed array tag. The element column for the 1D Array Int 16(index) tag is grayed out to prevent edits.
Graphical representations of the tags in Data View are available if desired. Click on the Toggle Graph View button to display the graphing functions. By default the Data View window is configured with a Horizontal Splitpane Layout. For the following example, a Vertical Splitpane Layout was selected.
Graph Tag(s): Highlight a tag(s) in the Data View window and select Graph Tag(s) to place these tags into the Graph window.
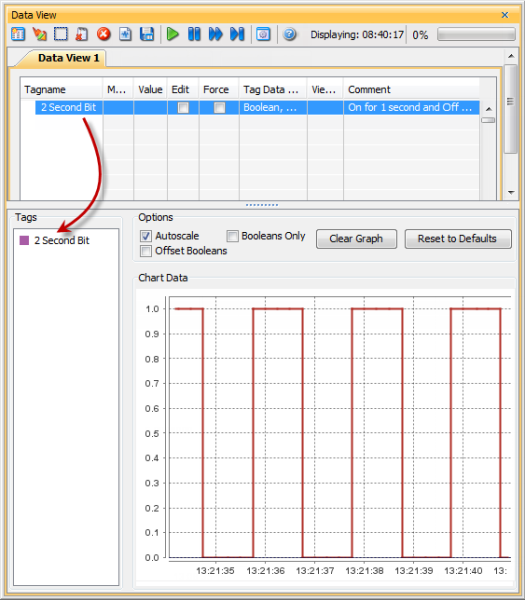

Note: The time displayed indicates the current data being viewed on the graph.
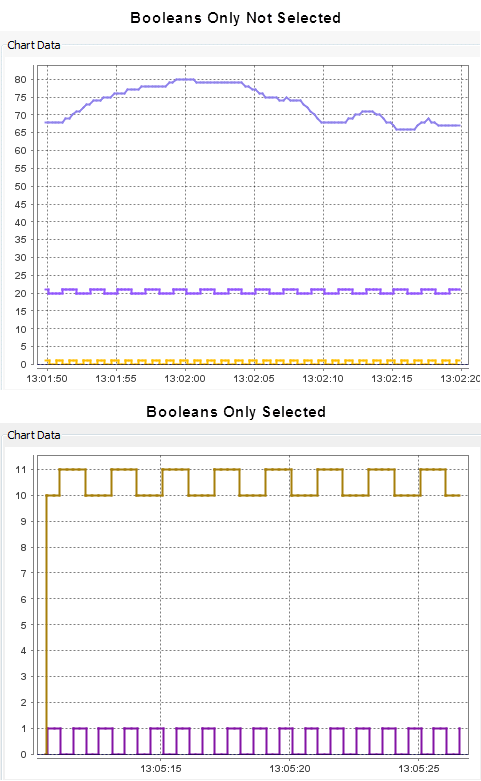
- Booleans Only: Select this option to show only the currently graphed Boolean tags.
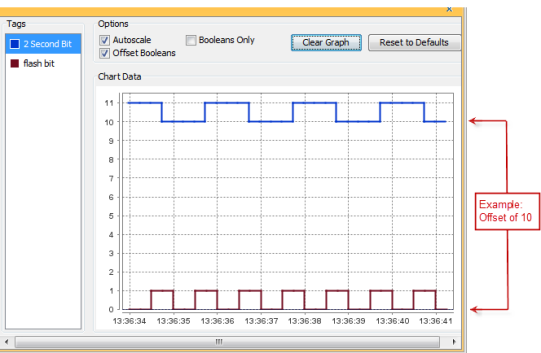
- Offset Booleans: This option will offset each boolean tag graphed by the Boolean Offset Multiplier set up in the Data ViewOptions.
Line Smoothing: Draws a smooth curve between two points.
Tool Tip: The Tool Tip allows a user to place the mouse cursor on a specific data point, then hover the cursor over that data point to read the actual graphed value and tag name as seen below.
Slider Bar:
 Collapse Arrows:

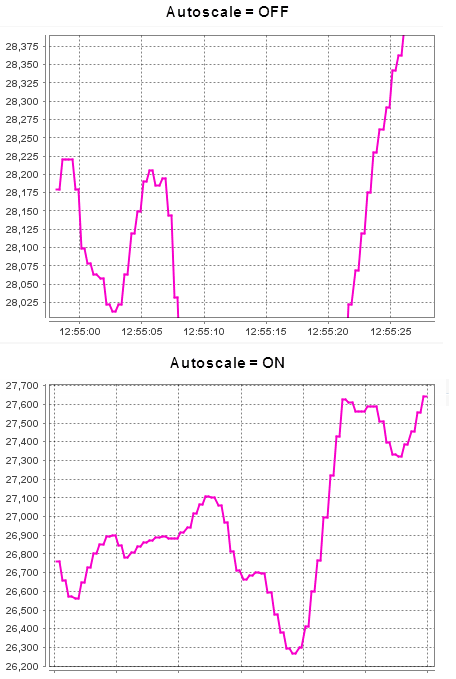
- Options (with Autoscale selected only).
- Graph Zoom Level.
- Disabled tags are re-enabled.
Allows user to enable the graphing function of Data View with the following options:
Note: The
Graph Options window is only
available by right clicking inside the graph area.
a. Print Graph: Allows user
to Print currently displayed
graphed tags.
b.
Save Graph: Allows user to
Save currently displayed
graphed tags as a
.png
file. 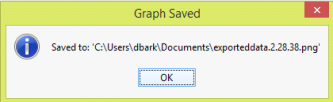
Note: This file is automatically stored in "Documents" folder.
c. Copy Graph: Allows a user
to Copy currently graphed
tags to the clipboard
to be
pasted into other applications.
I/O View is a quick and easy way to monitor all hardware points installed in a system. A user can also force on or off any discrete or analog point using I/O View.
Note: A tag(s) must be set as Forceable in the Tag Database and downloaded to the CPU before any point can be forced.
Note: You must first select
a point by holding
Ctrl + Left Mouse Click.
Then the point will be highlighted gray
 to begin forcing.
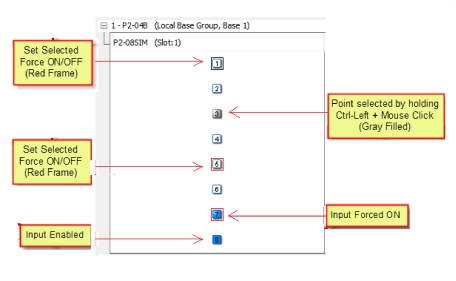
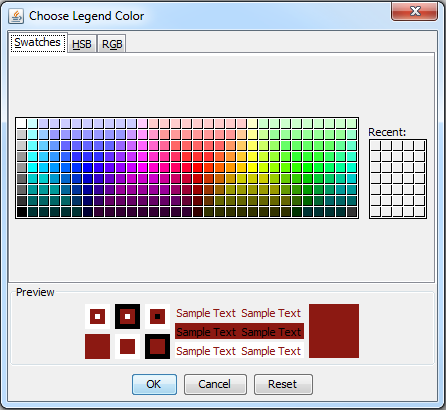
Legend |
|||

|
Discrete Input |

|
Discrete Output |

|
Point Selected as Forceable |

|
Point Forced OFF |

|
Point Selected |

|
Point Forced On |
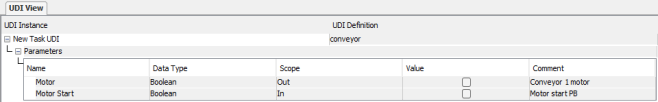
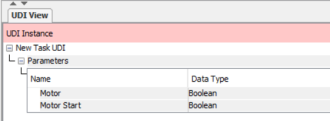
UDI (User Defined Instruction) view management panel is where users can add, delete, and view elements of a UDI instance.
Note: Users must be online with the CPU to expand and view elements of a UDI instance.
Entering the UDI instance name or selecting it from the dropdown will display the instance along with its associated elements.
Note: Making edits will cause the UDI view to become out of sync with the project, resulting in a red status indicator. This condition can only be resolved by performing a project transfer.
Right-Click Options
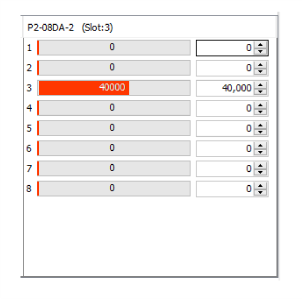
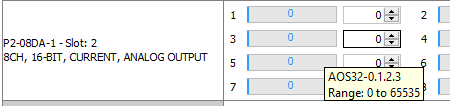
If you click on a cell of I/O and then hover over a point, the details associated with that point are displayed.
Show List: The Show List Icon is available when Data View tabs become too numerous to display all at once. When selected, a drop down menu will appear allowing the user to select one of the tabs that are off screen.
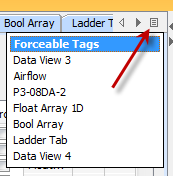
Table Editor: Allows the user to change the table display. Drag any field header to the left or right to change the display order.
Or right click on a field header to see the pop-up menu shown below. This menu allows adding, removing and resizing.
Selecting More... will display the Choose Columns to Display window shown here:
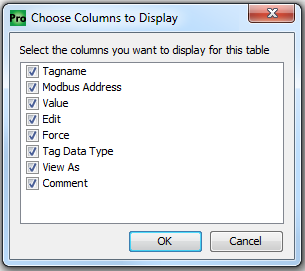
Both the right click menu and the Choose Columns to Display window allow the user to select which columns are visible in the table. The Choose Columns to Display window can be relocated on the screen for easier viewing.
Sorting Columns: Once you have entered your tags into the Data View window, you can sort the tags in each column by left-clicking on the desired column's header as seen below.
By left-clicking a third time the table will change back to the order you entered in the original table.
There are also Tag display options available by right clicking the tag in the Graph window. The following options are provided:
Zoom: Used to Zoom the graphing window.
To zoom the graphing window:
To zoom out the graphing window:
This Help File includes a topic that discusses the use of Force Tags. To open this topic and learn more about Forcing Tags, click on the green text.
The Force Indicator is a small lock with a red arrow
 that is displayed on the Data View window to indicate
that the Value of that specific Tag is
currently being Forced. The graphic shown below
provides an example of a Data View window with
Force Indicators being displayed.
that is displayed on the Data View window to indicate
that the Value of that specific Tag is
currently being Forced. The graphic shown below
provides an example of a Data View window with
Force Indicators being displayed.
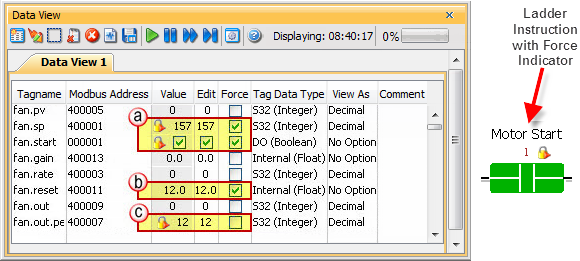
Tags can be Forced by clicking the appropriate check box under the Force column. When Forcing Tags through the Data View window, the Forces will NOT be active until the Send Edits button is selected. Once the Send Edit button is selected, the Force Indicators will display the newly added Forces.
From the graphic above we see the following: