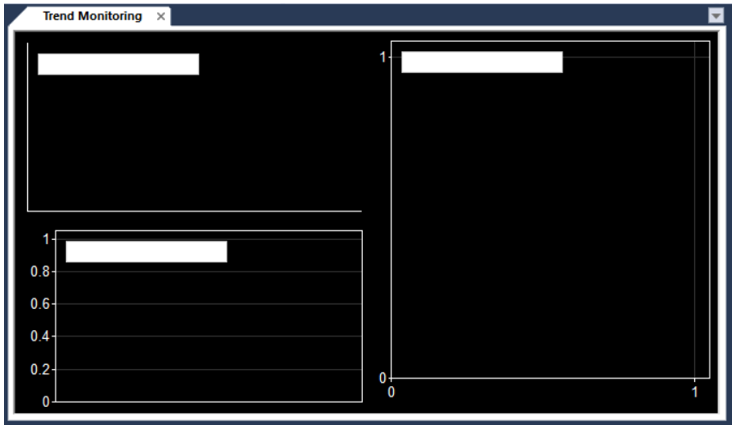
Trend Monitoring Functionality
XG5000 has a trend monitoring function that allows the user to test program code and trace axis movements. The available trends are the Bit Graph, Trend Graph, and XY Graph.
-
The Bit Graph is for trending of Boolean values with X axis being time.
-
The Trend graph can trend Boolean and numerical values with X axis being time.
-
The XY Graph trends two data points with one being the X value and the other being the Y value.
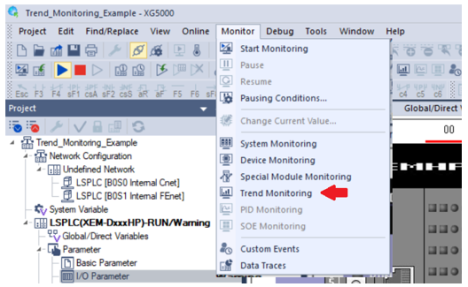
Opening the Trend Monitoring Window
| Step | Action |
|---|---|
| 1 | Open XG5000 project and connect to the PLC. |
| 2 |
Click on the Monitor tab and select Trend Monitoring.
The Trend Monitoring window will appear.
|
Overview of Trend Monitoring Functionality
LP116