Overview of Trend Monitoring Functionality
This topic provides an overview of the features and functions of the Trend Monitoring window.
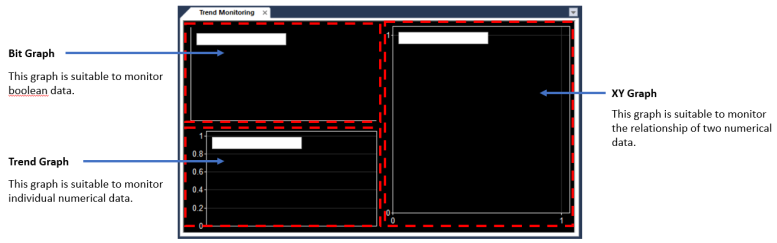
The Trend Monitoring window has 3 sections to monitor different types of data.
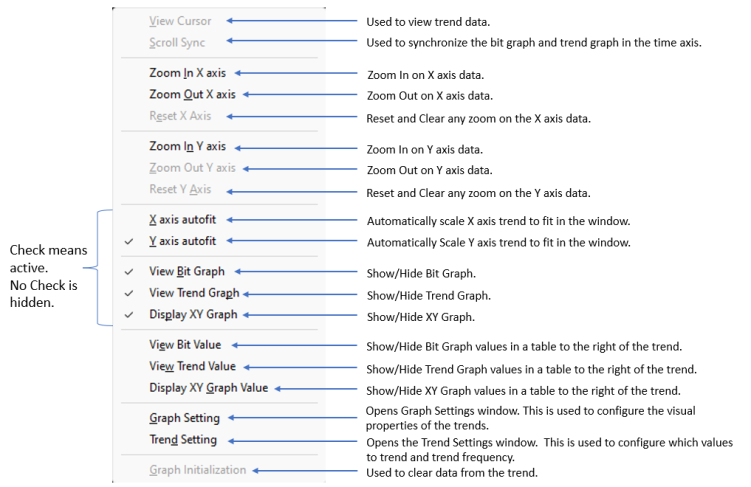
All controls for the Trend Windows are accessed by right-clicking in the Trend Window.
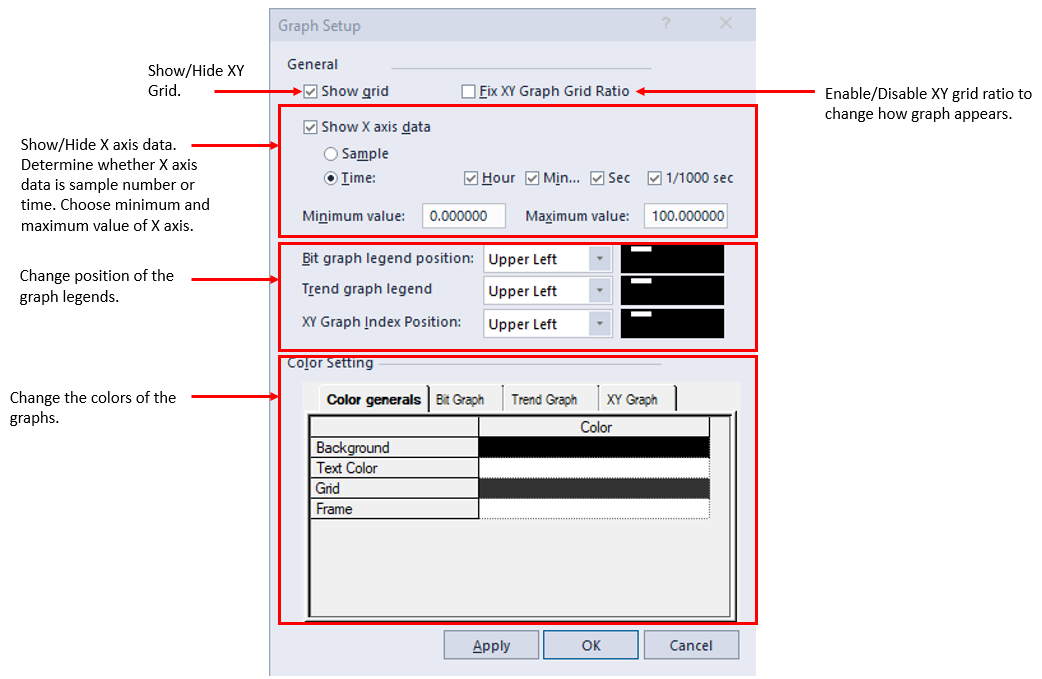
The Graph Setting screen is accessed by right-clicking on the Trend Monitor window and selecting Graph Setting from the menu. It is used to setup the visual aspects of the Trend Graphs.
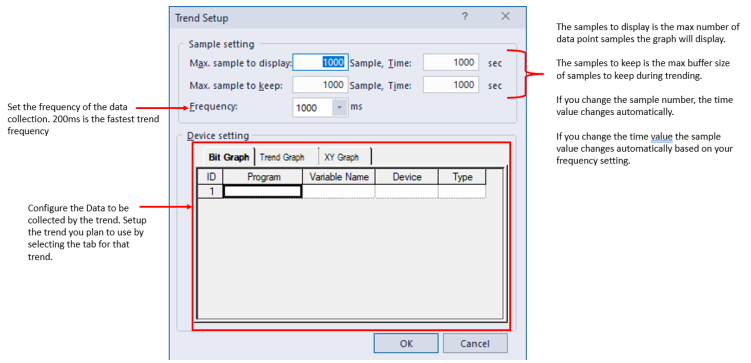
The Trend Setting screen is accessed by right-clicking on the Trend Monitor window and selecting Trend Setting from the menu. It is used to setup the data collection aspects of the Trend Graphs.
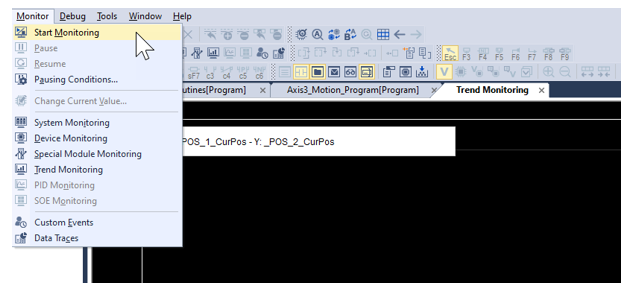
To start trending data in the Trend Window, the XG5000 project must have started monitoring and be in RUN mode.
With the Trend Monitoring window Open, select Monitor menu è Start Monitoring.
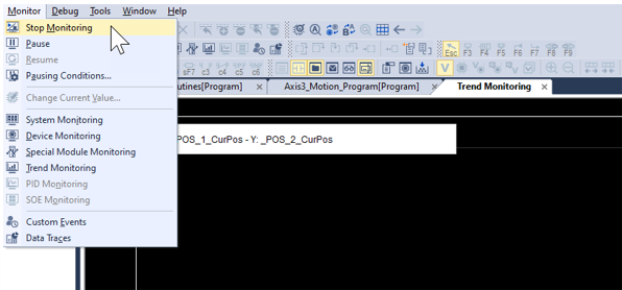
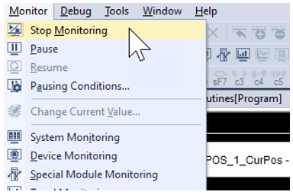
To stop trending data in the Trend Window, the XG5000 project must stop monitoring.
With the Trend Monitoring window Open, welect Monitor menuè Stop Monitoring.
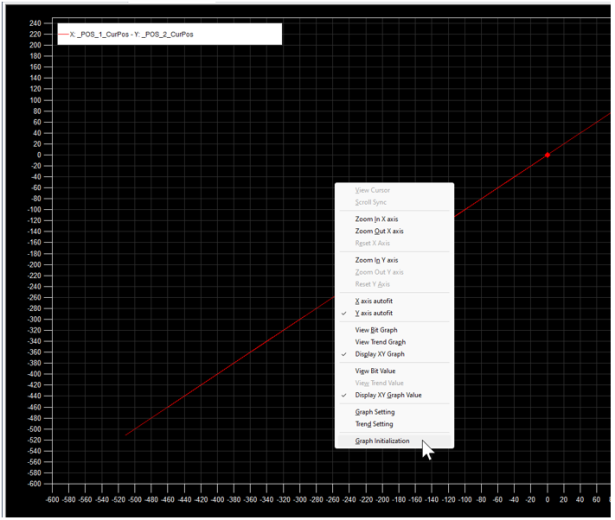
Trend data can be erased to start with a blank trend.
| Step | Action |
|---|---|
| 1 |
Right-click on the Trend Graph and select Graph Initialization.
|
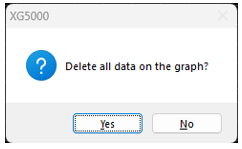
| 2 |
On the popup that appears, select Yes to delete the data. If you press No, the data will not be erased.
|
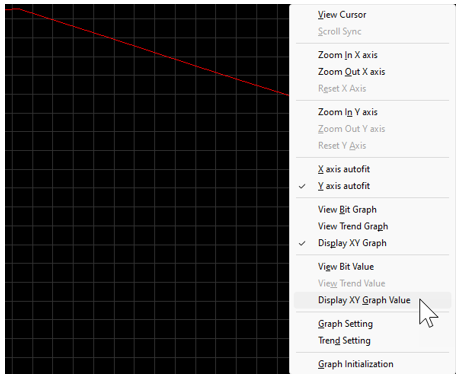
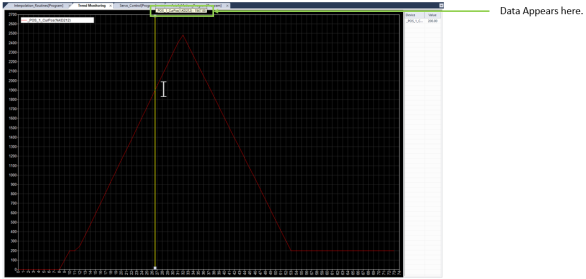
Trend Data values from the graph can be seen by enabling the View Graph data setting for the trend being used.
| Step | Action |
|---|---|
| 1 |
Stop Monitoring to stop the gathering of new trend data.
|
| 2 |
Right-click on the graph, then select the appropriate option for the graph type:
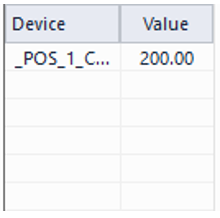
A value table will appear on the right side of the graph.
|
| 3 |
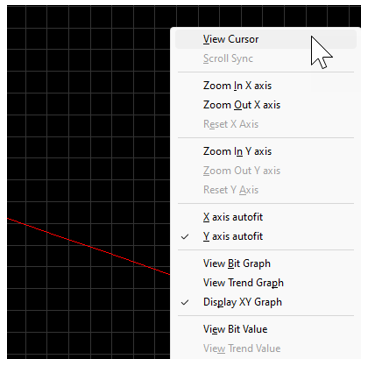
To start viewing data, right-click on the graph and select View Cursor.
|
| 4 |
Left-click on a section of the graph to see the data by the yellow cursor line.
|
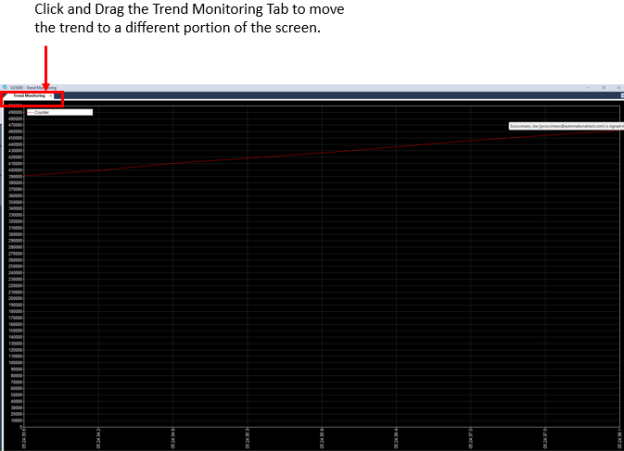
The Trend Monitoring window can be moved to a position outside of XG5000. This allows the user to see the trend and monitor their code at the same time.
LP116-1