Using Trend Graph Example
The steps below provide an example of how to use the Trend Graph.
| Step | Action |
|---|---|
| 1 | Open your XG5000 project and connect to the PLC. |
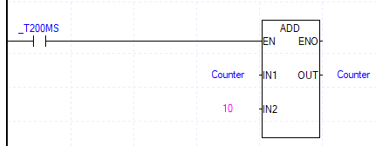
| 2 |
Add the ladder code shown below to a scan program. This example shows a scan program called NewProgram. Counter is a local DINT.
|
| 3 | Save the project and write it to the XEM CPU. |
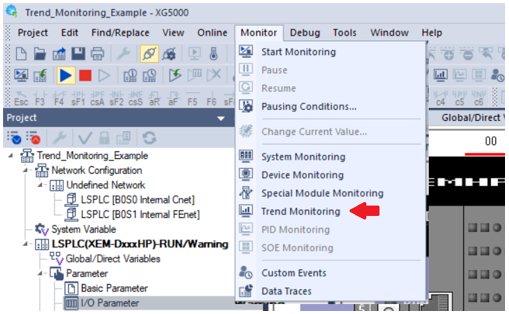
| 4 |
From the Monitor pull-down menu, select Trend Monitoring.
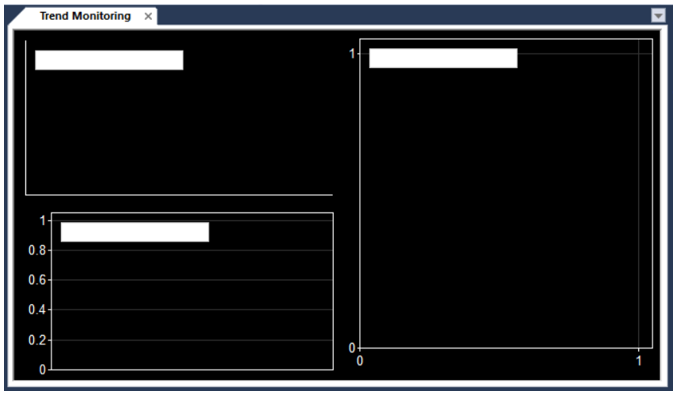
The Trend Monitoring window appears.
|
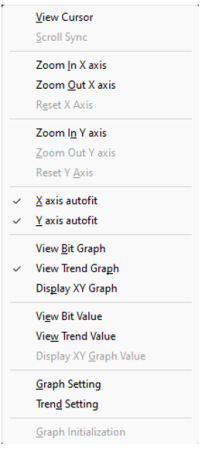
| 5 |
Right-click on the Trend and make sure only View Trend Graph is selected.
|
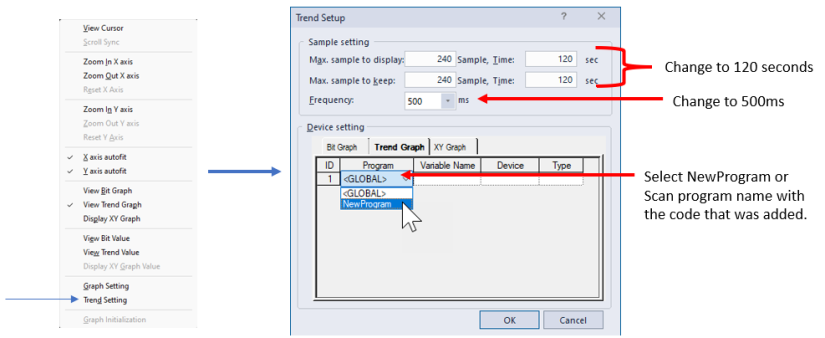
| 6 |
Open the Trend Setting window from the right-click menu. Set the Frequency to 500ms and each Sample, Time to 120 seconds. Then in the Trend Graph tab under Device setting select NewProgram in the Program column.
|
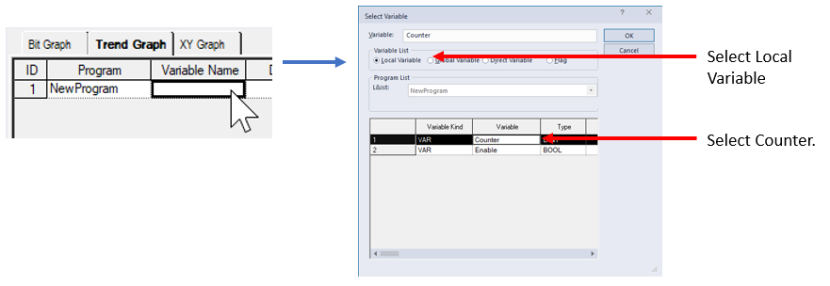
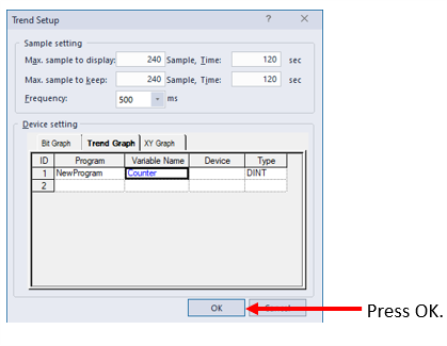
| 7 |
Double-click in the Variable Name column to select the Counter variable.
Press OK when done.
|
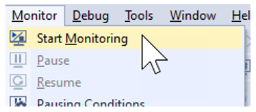
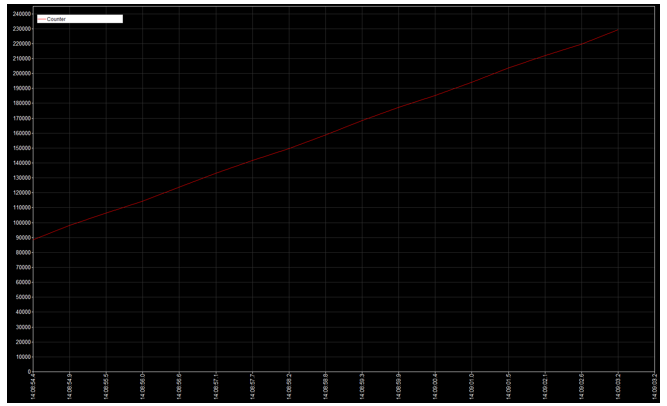
| 8 |
Select Start Monitoring from the Monitor menu to record Trend Graph data.
The data will start recording.
|
LP116-3