Using XY Graph Example
The steps below provide an example of how to use the XY Graph.
| Step | Action |
|---|---|
| 1 | Open your XG5000 project and connect to the PLC. |
| 2 |
Add the ladder code shown below to a scan program. This example shows a scan program called NewProgram. Counter and Counter2 are local DINT variables.
|
| 3 | Save the project and write it to the XEM CPU. |
| 4 |
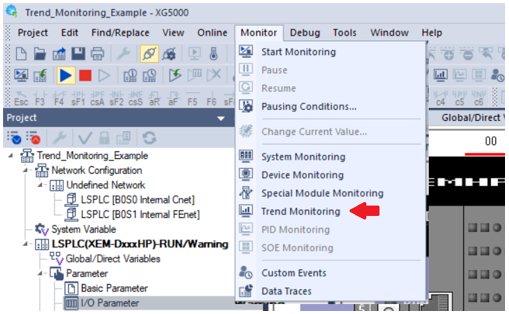
From the Monitor pull-down menu, select Trend Monitoring.
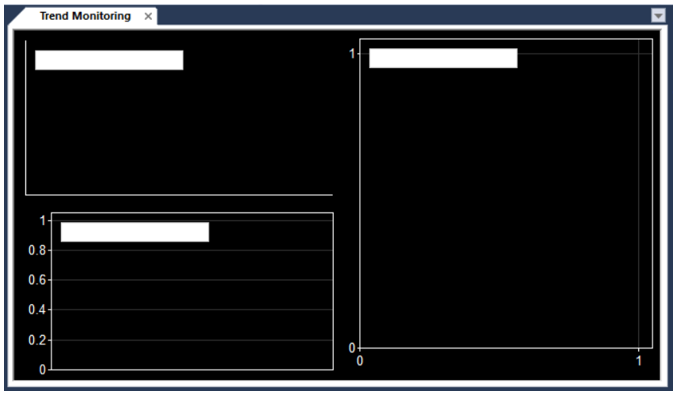
The Trend Monitoring window appears.
|
| 5 |
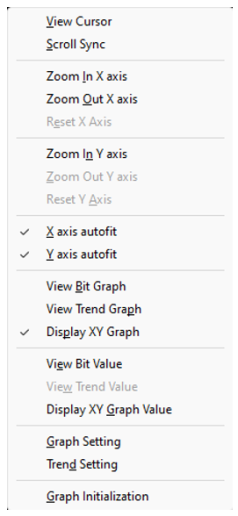
Right-click on the Trend and make sure only Display XY Graph is selected.
|
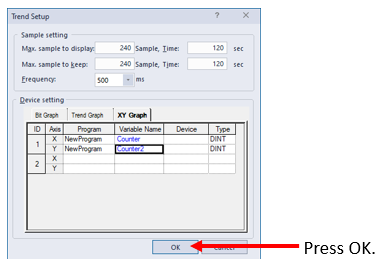
| 6 |
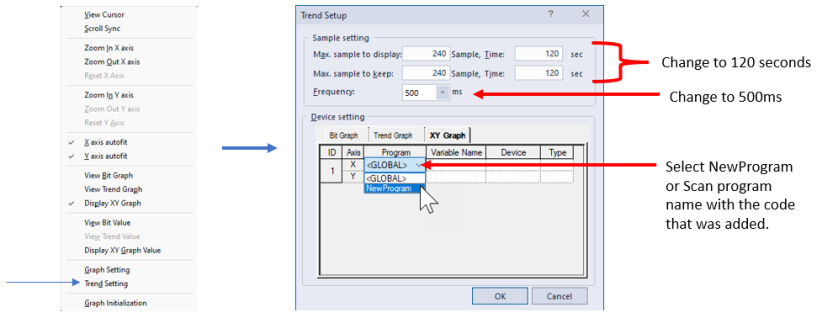
Open the Trend Setting window from the right-click menu. Set the Frequency to 500ms and each Sample, Time to 120 seconds. Then in the XY Graph tab under Device setting select NewProgram in the Program column for both X and Y.
|
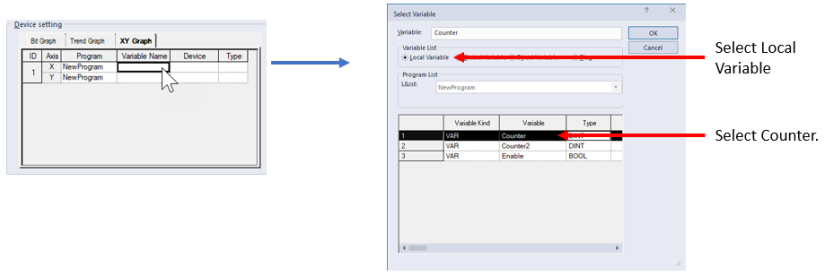
| 7 |
Double-click in the Variable Name column for the X axis to select the Counter variable.
|
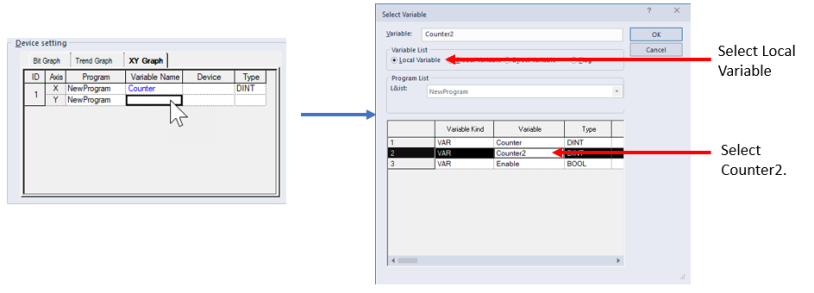
| 8 |
Double-click in the Variable Name column for the Y axis to select the Counter2 variable.
Press OK when done.
|
| 9 |
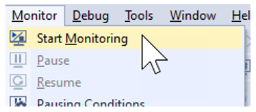
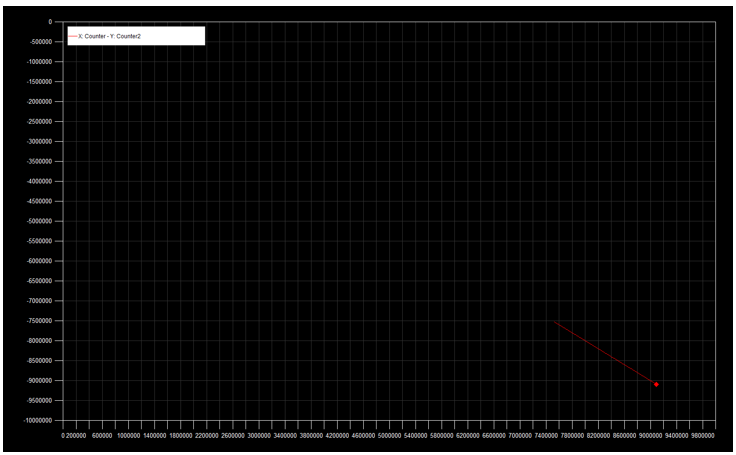
Select Start Monitoring from the Monitor menu to record XY Graph data.
The data will start recording.
|
LP116-4