|
|
Topic: P073 |
PID Tuning |
|
|
|
Topic: P073 |
PID Tuning |
|
PID Tuning is used to Monitor and Tune PID Loops within a process. The PID Tuning window charts the Loop Variables and allows for Manual or Auto Tune of each Loop.
Note: At least one PID Loop must be configured and the project transferred to the CPU before PID Tuning can be accessed. The tuning graphic shown in this topic is displayed only when connected to the CPU, the offline display will differ slightly.
PID Tuning can be accessed by selecting PID Tuning from the Tools Menu of the Main Menu or by selecting PID Tuning from the Monitor & Debug topics of the Application Tools panel.
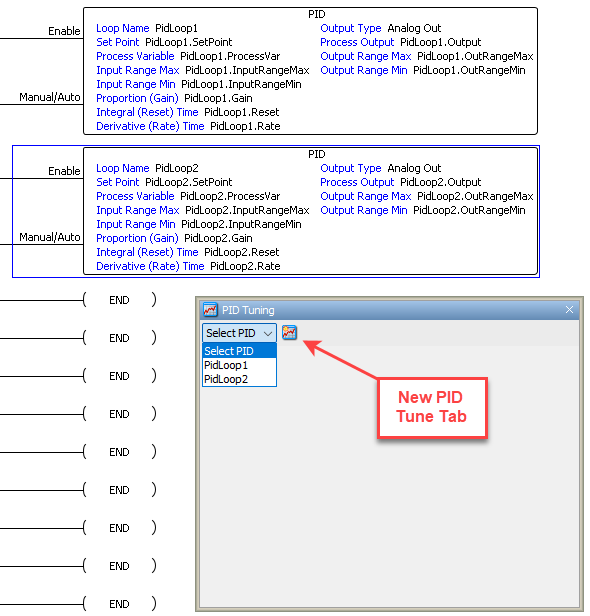
Right clicking on any PID instruction and selecting PID Tuning from the drop down list will add the selected loop to the PID Tuning window.
Once the PID Tuning window opens, the PID loop selected with the right click menu above should appear; otherwise, select the desired PID loop from the drop down list. Then click the New PID Tune Tab to begin monitoring.
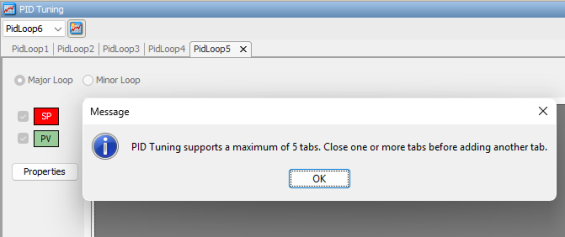
When more than one loop is selected, the PID Tuning window will monitor each loop without losing data when moving between tabs. As a result, a maximum of 5 tabs can be viewed at any one time.
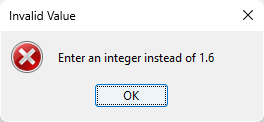
Note: Duplicate PID loop names are not allowed in versions 1.6 or higher of the Productivity Suite Software. The following error window will appear if a duplicate name is attempted.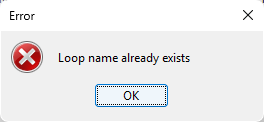
- Proportional Gain: Edit field, display field and write edits check box.
- Integral Time: Edit field, display field & write edits check box.
- Derivative Time: Edit field, display field & write edits check box.
- SP: Edit field, display field & write edits check box.
- PV: Edit field, display field & write edits check box.
- Bias: Edit field, display field & write edits check box.
- Output: Edit field, display field & write edits check box.
Note: When entering Values in any of the Online View PID Settings
fields, the Value
must correspond to the Data
Type of the Tag
used in the field. For example, if the
Tag for the field is an
Integer, an Integer
must also be used for the edit Value.
If the wrong Value Type
is used, an Invalid Value
window like the one shown below will display.
Note: Auto Tuning a PID Loop while connected to your process can cause unexpected results. The Ziegler-Nichol Closed Loop Tuning method is used to drive the control output fully ON to drive the Process Variable (PV) above the configured Set Point (SP) then drive the control output fully OFF until the PV drops below the SP. It repeats this method for three complete cycles to accurately calculate the new P-I-D values for your process. Auto Tune will not drive the Output past the limits set by Output Upper Limit and Output Lower Limit.
Note: The Initial PV Bump must generate a value larger than PV Deadband. If the Set Point and Process Variable are close to Zero or to the range limits at the time the Auto Tuning begins, you may experience erratic behavior or a failed Auto Tune.
This section discusses, in general, the configuration options available when creating chart pen graphs. For more information, see the Chart Properties topic. When selected, the Chart Properties window, shown below, will open.
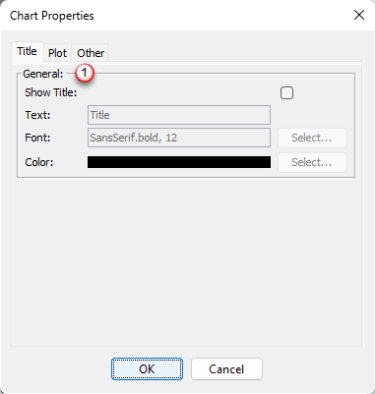
The Chart Properties window opens with the Title Tab selected by default and provides the following settings:
Allows configuration of the Chart Axis and appearance.
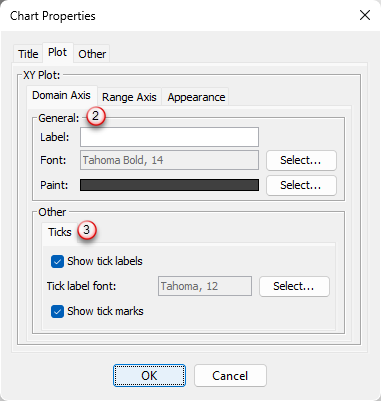
Domain Axis Tab: The X-Axis of the chart. Displays Elapsed Time in 30-second grids.
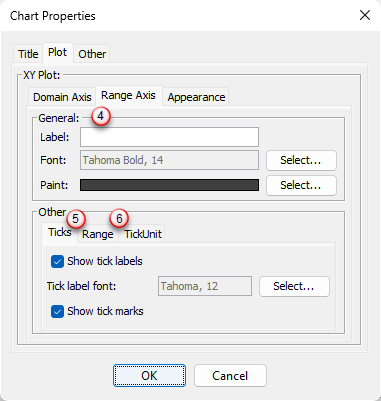
Range Axis Tab: The Y-Axis of the chart. Displays the Min/Max range of the Process Variable as configured in the PID Loop.
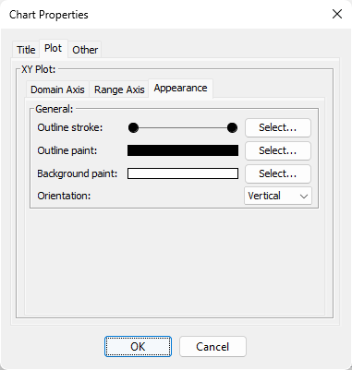
The Appearance Tab provides options for customizing the graphs boarder thickness and color, background color and vertical or horizontal orientation of the graph. Click on the Select button or the Down arrow to edit the respective option.
The Other Tab provides a Draw Anti-aliased checkbox to minimize distortion of the drawn lines, which is checked by default. The Select button allows selection of a Background Color for the exterior of the graph.
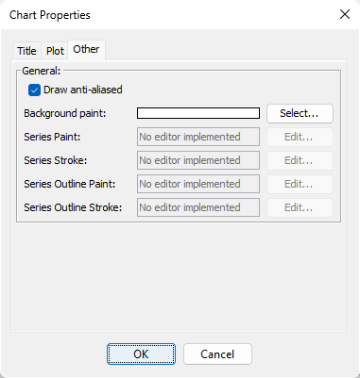
Note: Under the Other tab, the only feature available is the background paint. All others are not supported by the Productivity Suite software.
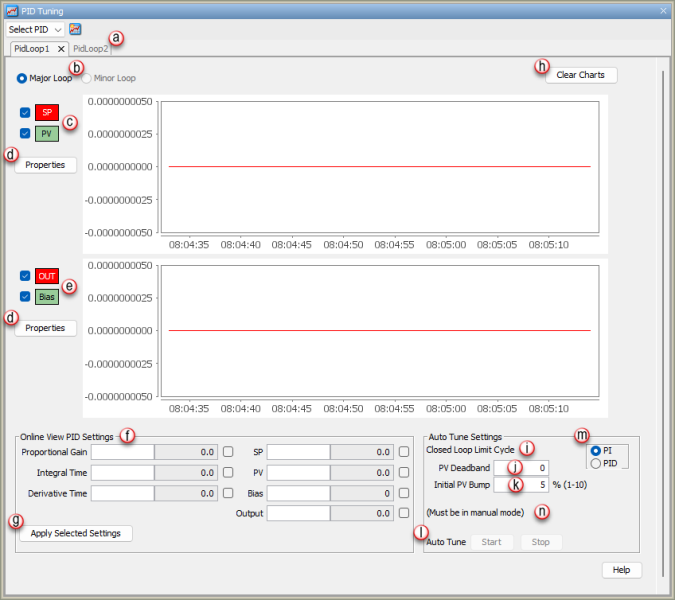
PID Tuning is used to Monitor and Tune PID Loops within a process. The PID Tuning window shown below charts the Loop Variables when the Minor Loops is selected (Item a) and allows for Manual or Auto Tune of each Loop.
- Proportional Gain: Edit field, display field and write edits check box.
- Integral Time: Edit field, display field & write edits check box.
- Derivative Time: Edit field, display field & write edits check box.
- Auto SP: Edit field, display field & write edits check box.
- PV: Edit field, display field & write edits check box.
- Bias: Edit field, display field & write edits check box.
- Output: Edit field, display field & write edits check box.
- Cascade SP: Display field only.
Note: When entering Values in any of the Online View PID Settings
fields, only enter Integer
Values. If a Float
Value is entered, an Invalid
Value Error window like the one shown below will display. 
Note: Auto Tuning a PID Loop while connected to your process can cause unexpected results. The Ziegler-Nichol Closed Loop Tuning method is used to drive the control output fully ON to drive the Process Variable (PV) above the configured Set Point (SP) then drive the control output fully OFF until the PV drops below the SP. It repeats this method for three complete cycles to accurately calculate the new P-I-D values for your process. Auto Tune will not drive the Output past the limits set by Output Upper Limit and Output Lower Limit.
Note: The Initial PV Bump must generate a value larger than PV Deadband. If theSetpoint andProcess Variable are close to 0 or the range limits at the time the Auto Tuning begins, you may experience erratic behavior or a failed Auto Tune.
PI / PID Radio Button: Tuning methods:
The following assumes a Forward-acting Loop:
Note: In order to Auto Tune the PID loop, the loop must be set to Manual Mode. See the PID Loop Instruction section of the Instructions chapter for a more detailed explanation of this mode.
- The current PV is copied to the set point.
- The Output is driven to either the Output upper limit or Output range max. (whichever value is lesser).
- When the PV reaches the value defined by the Initial PV Bump, the Output is driven to either the Output lower limit or Output range min. (whichever value is greater).
- When the PV reaches the set point, the Output is driven to either the Output upper limit or Output range max. (whichever value is lesser).
- When the PV reaches the set point, the Output is driven to either Output lower limit or Output range min. again (whichever value is greater).
- This Output cycling pattern continues for three full cycles.
- Once complete, the Auto Tune calculates new values for P, I and D (if selected) and writes them to the appropriate tags.
- The Loop is still in Manual Mode so the Output returns to it's value before the Auto Tune started.
Example:
Note: We do not recommend the above settings, they are solely for demonstration purposes only.
Now that the PID loop has been auto tuned, the loop should be placed back into Auto Mode. See the Manual Tuning section below if additional corrections are needed once loop is placed in Auto Mode. The Auto Tuning feature in the CPU runs only at the command of the Process Control engineer. The Auto Tuning therefore does not run continuously during operation (this would be Adaptive Control). Whenever a substantial change in Loop dynamics occurs (mass of process, size of actuator, etc.), you will need to repeat the Auto Tuning.
Before manual tuning of the PID loop can occur, the loop must be placed in Auto Mode if not already there. Use the following checklist when switching the loop to Auto Mode for the first time:
Note: In order to Manually Tune the PID loop, the loop must be set to Auto Mode. See the PID Loop Instruction section of the Instructions chapter for a more detailed explanation of this mode.
Once these checklist is complete, the PID loop can now be transitioned to Auto Mode:
If the PV and Control Output values begin to oscillate, reduce the Gain values immediately. If the Loop does not stabilize immediately, then transfer the Loop back to Manual Mode and Manually write a safe value to the Control Output. During the Loop Tuning procedure, always be near the Emergency Stop switch that controls power to the Loop actuator in case a shutdown is necessary.