|
|
Topic: P203 |
Chart Properties |
|
|
|
Topic: P203 |
Chart Properties |
|
Chart Properties provide the user with a variety of selections to set up the visual characteristics of the display chart which include:
The Title Tab is where the Chart Title, Font and Color are configured. The Title is displayed above the chart.
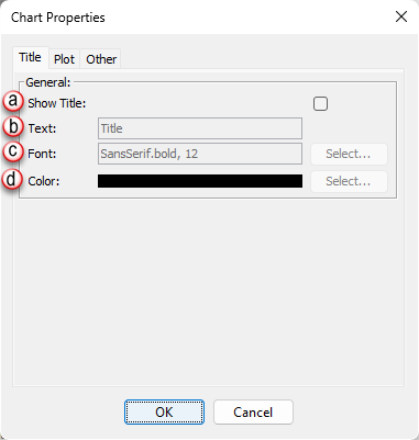
The Title Tab offers the user the following setup properties:
The Plot Tab is used to configure the XY Plot characteristics and provides the following setup properties:
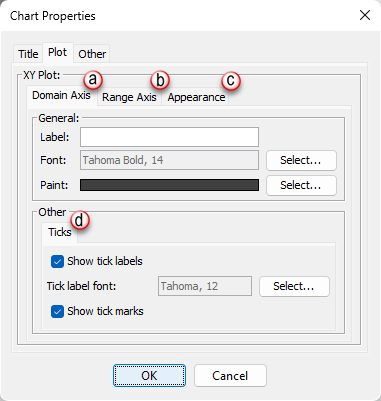
- Label: Enter the Label in the Text field.
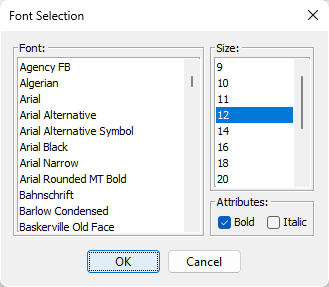
- Font: Click on the Select button to pop up the Font Selection window and select the Font Style, Size and Attributes. Select OK to accept and close the Font Selection window. The selected Font Style will be displayed in the text field. For more details see the Font Selection description.
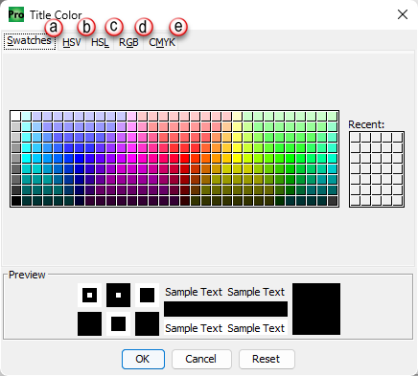
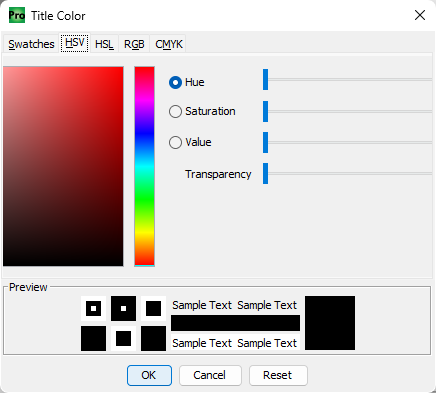
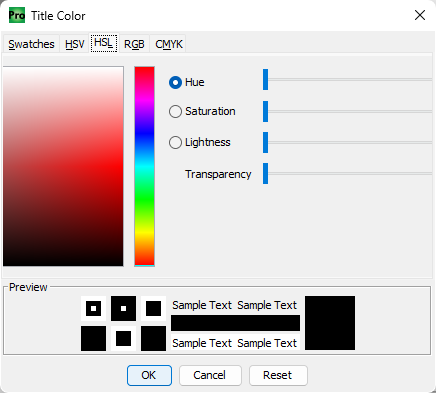
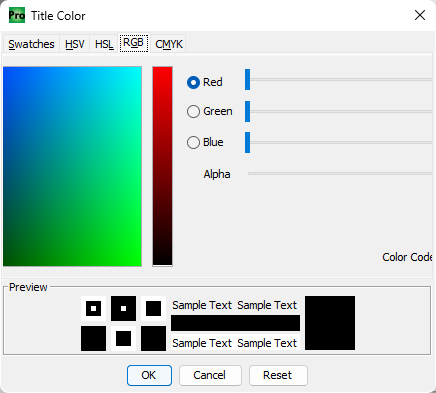
- Paint: Click on the Select button to pop up the Label Color window and select the properties of the Label color. Select OK to accept and close the Label Color window. The final color example will displayed in the Color field. Selecting Cancel will close the Label Color window without saving changes. Selecting Reset will return to the original color. For more details see the Color Selection description.
- Label: Enter the Label in the Text field.
- Font: Click on the Select button to pop up the Font Selection window and select the Font Style, Size and Attributes. Select OK to accept and close the Font Selection window. The selected Font Style will be displayed in the text field. For more details see the Font Selection description.
- Paint: Click on the Select button to pop up the Label Color window and select the properties of the Label color. Select OK to accept and close the Label Color window. The final color example will be displayed in the Color field. Selecting Cancel will close the Label Color window without saving changes. Selecting Reset will return to the original color. For more details see the Color Selection description.
- Range: The Range Tab is used to set up the Minimum and Maximum Range Values for the chart or to allow the range to Auto-adjust with the plotter values.
- Auto-adjust range: To set the chart Range to Auto-adjust, select the check box.
- Minimum range value: Enter the Minimum value for the chart in the text field. When Auto-adjust is selected, Minimum range value will be disabled.
- Maximum range value: Enter the Maximum value for the chart in the text field. When Auto-adjust is selected, Maximum range value will be disabled.
- Outline stroke: Click on the Select button to pop up the Stroke Selection window.
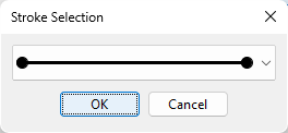
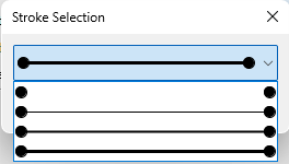
Click on the down arrow
![]() to display the drop down menu of
Stroke Selection options. Select the desired stroke and click
OK.
to display the drop down menu of
Stroke Selection options. Select the desired stroke and click
OK.
- Outline paint: Click on the Select button to pop up the Outline Color window and select the properties of the Outline color. Select OK to accept and close the Outline Color window. The final color example will be displayed in the Color field. Selecting Cancel will close the Outline Color window without saving changes. Selecting Reset will return to the original color. For more details see the Color Selection description.
- Background paint: Click on the Select button to pop up the Background Color window and select the properties of the Background color. Select OK to accept and close the Background Color window. The final color example will be displayed in the Color field. Selecting Cancel will close the Background Color window without saving changes. Selecting Reset will return to the original color. For more details see the Color Selection description.
- Orientation: Click on the down arrow
to display the drop down menu of Orientation options (Vertical or Horizontal). Select the option and click OK.

- Show tick labels: To display Tick Labels, select the check box.
- Tick label font: Click on the Select button to pop up the Font Selection window and select the Font Style, Size and Attributes. Select OK to accept and close the Font Selection window. The selected Font Style will be displayed in the text field. For more details see the Font Selection description.
- Show tick marks: To display Tick Marks, select the check box.
The Other Tab controls line distortion and chart colors.
Note: Under the Other tab, the only feature available is the background paint. All others are not supported by the Productivity Suite software.
Click on the Font Select button to pop up a Font Selection window and select the Font Style, Size and Attributes. Select OK to accept and close the Font Selection window. The selected Font Style will be displayed in the Font text field.
Click on the Color Select button to pop up the Color window and select the properties of the color. Select OK to accept and close the Color window. The final color example will be displayed in the Color field. Selecting Cancel will close the Label Color window without saving changes. Selecting Reset will return to the original color.