You can learn about the various aspects of the Scope interface by clicking on the options below.
Open a SCP File
Open a saved SCP (scope curve) file. |
|
Save as a SCP File
Save the captured SCP file to the computer. |
|
Zoom in (F5) / Zoom out (F6)
Use the buttons or the F5 and F6 keys to zoom the entire scope in or out. |
|
Previous Screen (F7) After adjusting the size of the scope, use this function to go back to the previous setting. |
|
Show All Screen with same coordinate
Default view- returns the scope display to original size and sets all Y-axis values to the same scale. |
|
Show All Screen with different coordinate
Optimizes the Y scale with the full X-axis (time axis). |
|
Optimize the current view
Optimizes the Y axis so all traces can be viewed in a meaningful manner. |
|
Print Screen
Print the current scope image. |
|
Clear Screen
Clear the current scope image. |
|
Help
Open the SureServo2 Pro software help. |
|
Max. Duration
Adjust the X-axis scale in 20,000 ms increments. Setting range is 1-6 where 1 is 20,000 and 6 is 120,000. |
|
Sampling
Adjust the rate at which the scope samples. 8K = 8kHz (8000/sec, or every 0.125ms), 16K = 16kHz (16000/sec, or every 0.062 ms). |
|
Run / Stop
Click Run to capture data. Click Stop to stop capturing. This button toggles between Run and Stop. |
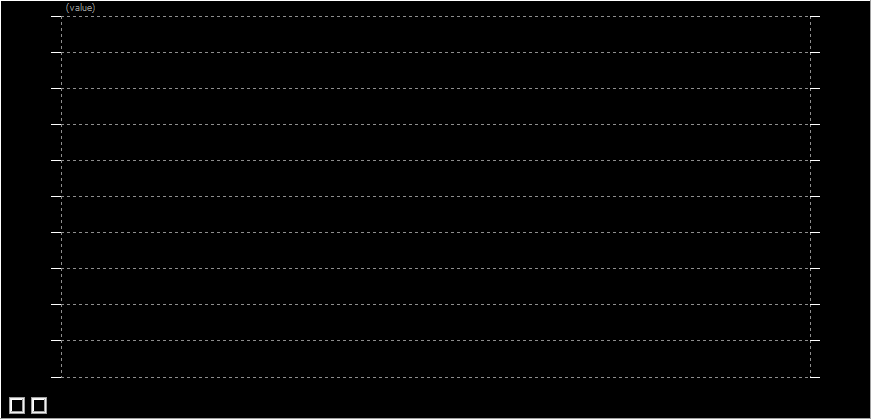
The X-axis of the screen represents time. The units are in seconds (sec).
The Y-axis of the screen represents data. The Y-axis on both sides will be used according to the selected channels.
Data displayed in the Y-axis is marked with the same coordinates when in initial status and is best for monitoring items which have the same unit. If the monitored items have different units, use the Show All Screen with different coordinate view to see the actual values.
The two boxes in the lower left corner of the screen change the screen background color and the background color of the graph.
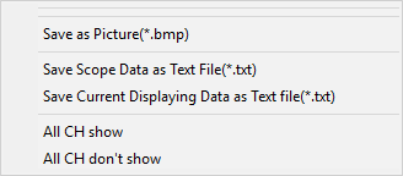
Right-clicking within the Scope screen brings up the options panel:
Save as Picture (*.bmp):Click to save the waveform as a bitmap image.
Save Scope Data as Text File (*.txt): Save all the data captured by the scope to a text file.
Save Current Displaying Data as Text File (*.txt):Save the data currently on the screen to a text file.
All CH show: Displays all channels.
All CH don't show: Hides all channels.
SureServo2 Pro's flexible channel setting allows you to access just the data you need. SureServo2 Pro provides Data and Relative as well as Time and Interval.
Note that different SureServo2 drives provide different monitor items. Not all monitor items may be available to your specific drive.
Channel Interface
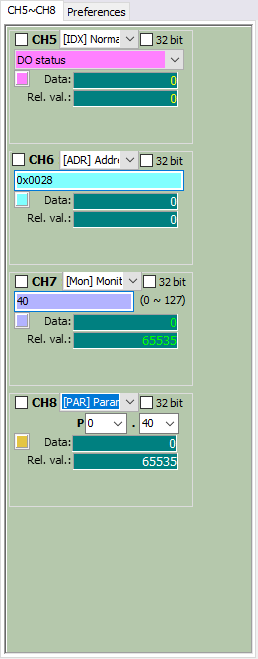
Some drives support up to 8 channels in 8kHz mode rather than the standard 4. Those systems will have a channel sidebar as shown below. Note that in 16kHz mode these channels will be hidden.
The following options are available:
Channels can be selected by clicking the checkbox next to each CHx (where x is usually 1-8). Some systems may have different numbers of channels available.
Command source can be selected from the drop down box in each channel. Options are:
[IDX] Normal: Directly access the built-in monitor item.
[ADR] Address: Enter the specific position format in hexadecimal to access monitor variables and parameters.
[Mon] Monitor: Enter the specific monitor variable code.
[PAR] Parameters: Enter the desired accessing parameter. Parameter format is either 16-bit or 32-bit. To use a 32-bit parameter, check the 32 bit box on the channel.
Note: If a channel is set for 32-bit, SureServo2 Pro will automatically close another channel to support the 32-bit usage. Channels are grouped - Channel 1 and 3 are one group, 2 and 4 are another group, etc. If Channel 1 is set to 32-bit, then Channel 3 will be closed. If Channel 2 is set to 32-bit, Channel 4 will be closed, etc.
Color of the data trace can be configured by clicking the box next to Data and choosing a color.
The Data field displays the coordinates of the cursor for that channel.
The Rel. val (Relative Value) field compares the current position to the original position. Click the cursor to set the relative value to 0. When the cursor is moved around the curve, the relative value is calculated.
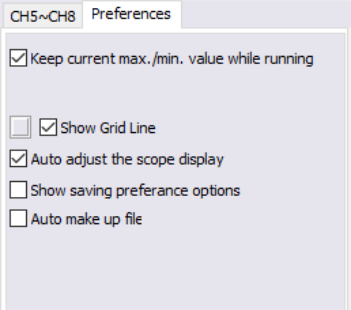
The preferences tab is located on the right side of the screen by default (next the Channels 5 through 8) and contains several options for the Scope.
Keep current max./min. value while running: Causes the graph to stay with the currently-displayed vertical range (Y-axis) when you press “Run”. If you zoom in very close there is a chance you might not see the graph working (if you are viewing 500-800 rpm range and the motor is actually running 100-200rpm). As soon as you press “Stop”, the graph resets the range for the Y-axis so you can see all your data points. This allows you to zoom in to a tight range if you know that your graph is only going to be in a small window. Example: If you have zoomed in to 100-200 rpm and have this box checked, the graph will only show the 100-200 rpm range. If the box is not checked, when you press “Run” the graph will immediately zoom out to 3000 rpm.
Show Grid Line: Check this function to show a grid line on the screen; the gray button before the checkbox can be used to setup the color. Light gray is the default setting.
Auto adjust the scope display: This option will reset the size of the display area to a default size. Deselecting will zoom the display area back to where you had it.
Show saving preference options: Changes the options that pop up when you click on the Save button. If this is not checked, you are prompted to save the Scope data. If this is checked, you get a chance to save the Scope data (in an .SCP file) as well as all the Parameters in the drive (in a combined .PARSCP file). The PARSCP file can be opened by the Scope>Open command or from the Parameter Editor window (using the Open command).