PID Faceplate Trend Graph Object |
Topic: CM320 |
PID stands for Proportional Integral Derivative. PID is an algorithm used by PLC to control a process using a Control Loop. The PID Faceplate Trend Graph Object is used to monitor Control Loop assigned Tag Names continuously. This Object is much like a digital version of a chart recorder used for industrial processes.
|
|
Note: You can select the option to suppress scientific notation (exponential notation) when using Floating Point Data in the Panel Manager window. This is a global selection and applies to all Floating Point Data display objects. |
|
|
Note: To retain Data displayed by a Faceplate Trend Graph object after a power cycle, Logging must be configured on the Options tab. |
Add a PID Faceplate Trend Graph Object to Your Project
To add a PID Faceplate Trend Graph Object to your project, do the following:
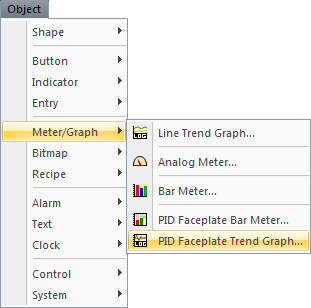
- From the Object Menu, select Meter/Graph, and click on PID Faceplate Trend Graph and then click on the work area
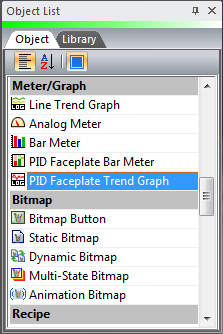
— or — - from the Object List, click and drag PID Faceplate Trend Graph to the work area.
- The PID Faceplate Trend Graph Object set-up window opens displaying the General tab.
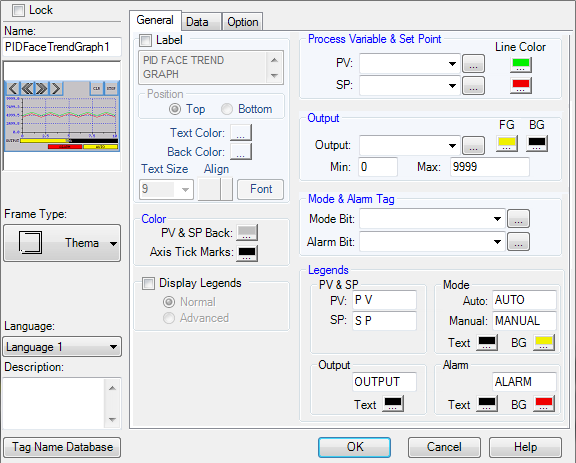
The General tab is the default tab and is used for the basic configuration of the PID Faceplate Trend Graph Object.
To configure a PID Faceplate Trend Graph Object, complete the fields on the screen that are common to all objects using the information in the Working with Objects Help topic.
Then complete the remaining fields on the screen using the information in the table below:
| PID Faceplate Trend Graph Window — General Tab | |
|---|---|
| Field | Description |
| General Tab | |
| Process Variable and Set Point | Use the PV and SP tags to represent the Process Variable and Set Point tags in your PID loop controller. The color selected for the SP and PV will be the pen color on the trend graph as well as the legend. |
| Output | Use the Output tag to represent the Output tag in your PID loop controller. The Output FG and BG colors will be the foreground and background colors for the Output bar graph under the trend graph. |
| Mode and Alarm Tags | Use the Mode Bit tag to represent the PID loop controller Mode, typically Manual or Auto. Use the Alarm bit tag to represent any bit in the controller that you wish to indicate on the PID faceplate object. |
| Color | PV and SP Back: Click to select the background color for the trend graph. Axis Tick Marks: Click to select the color for the Axis tick marks on the trend graph. |
| Display Legends | Displays a simple color legend for the SP and PV. If Advanced is selected, the trend graph will have a button for hiding each pen (SP and PV) and a button for hiding the entire legend. |
| Legends | |
| PV & SP | Enter Text that will be displayed in the Legend for SP and PV. |
| Output | Enter the text for the Output label and select the color. |
| Mode | Enter the label text to be displayed when the Mode Bit tag is off (Auto) and on (Manual). |
| Alarm | Enter the Text that will be displayed when the Alarm Bit is On and the Text and Background Color for the Alarm label. |
