Line Trend Graph Object |
Topic: CM244 |
The Line Trend Graph Object is designed to monitor an assigned Tag Name continuously.This Object is very much like a digital version of a chart recorder used for industrial processes.This Object can be setup to monitor up to 16 different Tag Names.
|
Note: The Trend Cursor value is only accurate to 1% of the Full Scale Range of the Line Trend Graph.For example, if full scale is 0 - 10 units, then the cursor will be accurate to 0.1 units.If full scale is 0 - 1000 units, then the cursor values will only be accurate to 10 units. |
|
Note: To retain Data displayed by a Line Trend Graph object after a power cycle, Logging must be configured on the Options tab. |
|
|
Note: You can select the option to suppress scientific notation (exponential notation) when using Floating Point Data in the Panel Manager window. This is a global selection and applies to all Floating Point Data display objects. |
Add a Line Trend Graph Object to your Project
To add a Line Trend Graph Object to your project:
-
From Meter/Graph in the Object Menu or the Object List, double-click on Line Trend Graph.
— or — -
click and drag the Line Trend Graph to the work area.
- Any available Line Trend Graph Objects are displayed on the Parts List window.If selecting a Line Trend Graph from the Parts List window, click and hold on the desired Line Trend Graph, drag it to the Work Area and release the mouse button.
-
Once a Line Trend Graph is selected using either method described above, the Line Trend Graph setup window shown below opens.
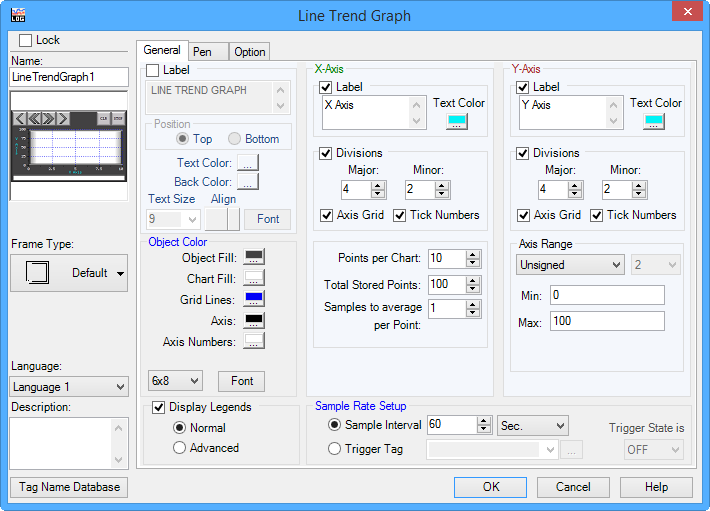
- Complete the fields on the screen that are common to all objects using the information in the Working with Objects Help topic.
- Complete the remaining fields on the screen using the information in the table below.
| Line Trend Graph | |
|---|---|
| Field | Description |
| General Tab | |
| Object Color | |
| Object Fill | The fill (background) color of the object. |
| Chart Fill | Select the fill color of the chart (plot area). |
| Grid Lines | Select the color of the grid lines on the chart. |
| Axis | Select the color of the Axis and tick marks. |
| Axis Numbers | Select the color of the Axis numbers. |
| 6x8 | Select the font size of the Axis labels and numbers. |
| Font | Select the font type for the axis labels and axis numbers. |
| Display Legends | Display the legend below the chart area. Normal Legends displays a Legend related to information being monitored. Advanced Legends displays the Normal Legends with the ability to hide the legend or individual pens. |
| X and Y Axes | |
| Label | This is the label for the Axis, represents time or number of the point.For the Y-Axis it represents the value of the Tag being charted.Enter a text up to 40 characters and multiple lines.Note: entering a new line accounts for two characters. |
| Text Color | Click to select the color of the Axis label. |
| Divisions | Add tick marks, tick numbers and grid lines to the chart area. Major - Major divisions have a tick mark, tick number and grid line. Minor - Minor divisions only have tick marks. |
| Axis Grid | Display Grid lines in the chart area corresponding to the Major divisions. |
| Tick Numbers | Display tick numbers on axis corresponding to the Major divisions. |
| Points per Chart | The number of points that to display (from 4 - 99) at one time on the chart. |
| Total Stored Points | The total number of Data points (from 10 to 65535) that can be seen on the chart.If the number is greater than the Points per chart, you can scroll back to see historical points. |
| Samples to average per Point | To smooth out large swings in the values of the Data points, you may average from 1 to 255 points. |
| Y Axis Range | |
| Unsigned | Select how the Y-axis numbers will be displayed, Unsigned, Signed or Floating point.If Floating point is selected, then select the number of decimal places to display. |
| Min Max | Minimum and Maximum numbers to display on the Y-Axis.any values beyond this will plot as a flat line at the bottom or top of the chart. |
| Sample Rate Setup |
Sample rate is the interval at which each Data point is saved. |
| Sample Interval | A Data point will be plotted at the Sample interval rate.For the default, a point will be plotted every 60 seconds. |
| Trigger Tag | A Data point will be plotted whenever the Trigger Tag (a discrete tag selected from the Tag Name Database) comes ON or goes OFF depending on the Trigger State setting.The Trigger Tag maximum cycle rate is 1 second. |
| Trigger State is | When Trigger Tag is selected, this plots a Data point when the Trigger comes ON or when the Trigger Tag goes OFF. |
Click OK.
