|
|
Topic: P061 |
Debug |
|
|
|
Topic: P061 |
Debug |
|
The Debug Mode allows the user to Debug the program ladder or Structured Text code by using tools provided in the software.
Note: To enable Debug Mode the CPU must be Online, the CPU Mode Switch must be in the RUN position and Stop Mode must be activated through the software.
There are three methods of accessing Debug:
Method 1
Use the Debug Icon
located on the Control CPU Toolbar.
Method 2
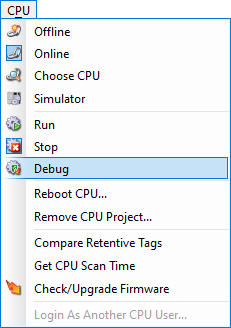
Select the Debug menu item from the CPU Menu, located on the Main Menu as shown below.
Method 3
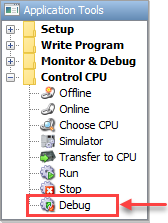
Select the Debug item from the Application Tools panel as shown below.
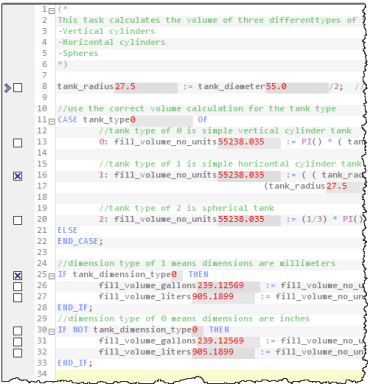
Once in the Debug Mode, there will be additional indicators in your ladder or Structured Text editor window as shown below.
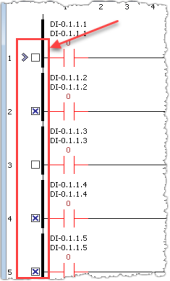
This icon indicates the current step or rung you are debugging.
This icon gives you the option of setting Breakpoints in your code. If you check one of the boxes
, this allows you to run the program up to that point and stop. This is a valuable tool as it allows you to view results on partial segments of code, where a typical scan executes top to bottom without stopping.
The Debug Toolbar is disabled in all modes except Debug. Once the user places the CPU in Debug Mode, the toolbar will become active as shown below.

The Debug Toolbar allows the following options for troubleshooting:
Execute Outputs Icon: If you do not select this option, you can step through the code without turning on any outputs (Safe Mode).
Single Step Icon: Single Step allows you to manually step from rung to rung and monitor results.
Run 1 Scan Icon: Run 1 Scan lets you cycle through your entire project once then stop for evaluation.
Run To BP Icon:Run to BP (Breakpoint) allows the option to execute up to a specified point then halt.
Stop Icon: Stop lets you stop any active debug process.
Show all Breakpoints Icon:Show all Breakpoints gives you a list of all rungs with active breakpoint selections as shown below.
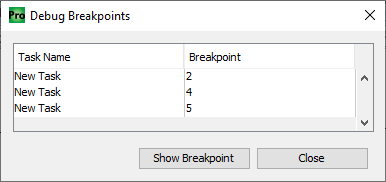
- By selecting any Breakpoint from the list and clicking Show Breakpoint, the ladder editor will be re-directed to that rung automatically.
Clear all Breakpoints Icon:Clear all Breakpoints will deselect all selected breakpoints.
Go to Current Rung Icon:Go to Current Rung will automatically go to the current rung while in Debug Mode.