EtherCAT XG-PM Trend Monitoring for Motion Control Status
Trend monitoring with the XBF-PN08B and XBF-PN04B is done with the XG-PM software.
-
XG-PM must be connected to the XEM CPU to perform Trend Monitoring.
-
This topic only covers how to use the Trend Monitoring feature to monitor motion control.
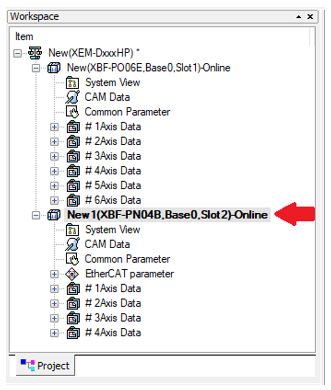
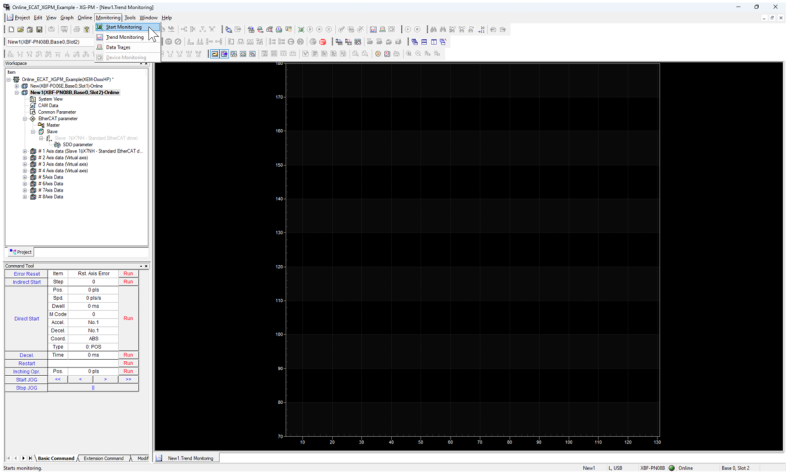
Select the XBF-PN04B or XBF-PN08B in the Workspace window before opening the Trend Monitoring window.
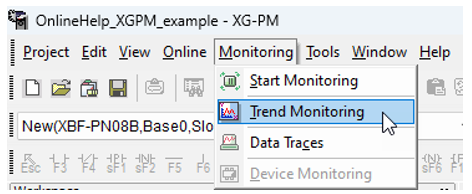
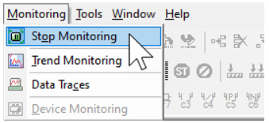
In XG-PM, connect to the CPU then select Trend Monitoring in the pull-down menu Monitoring.
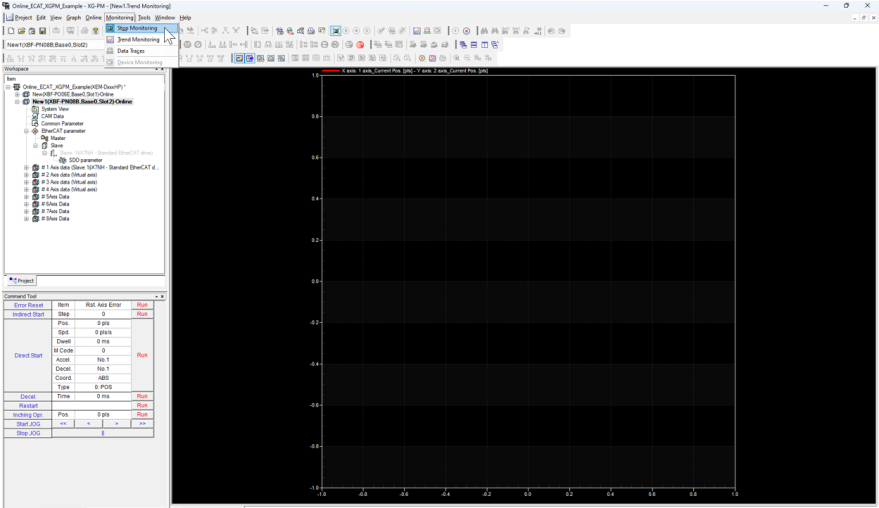
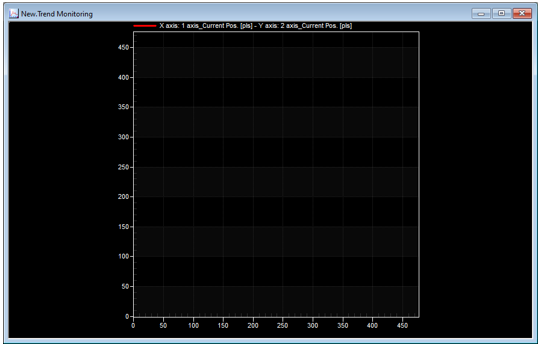
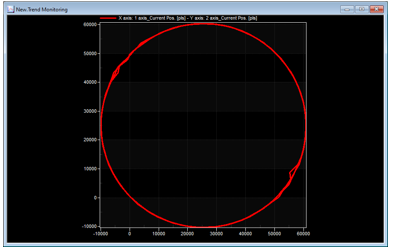
This blank Trend Monitoring window is displayed.
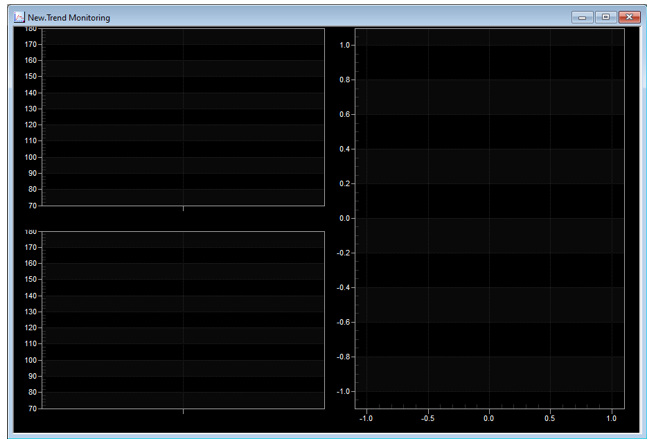
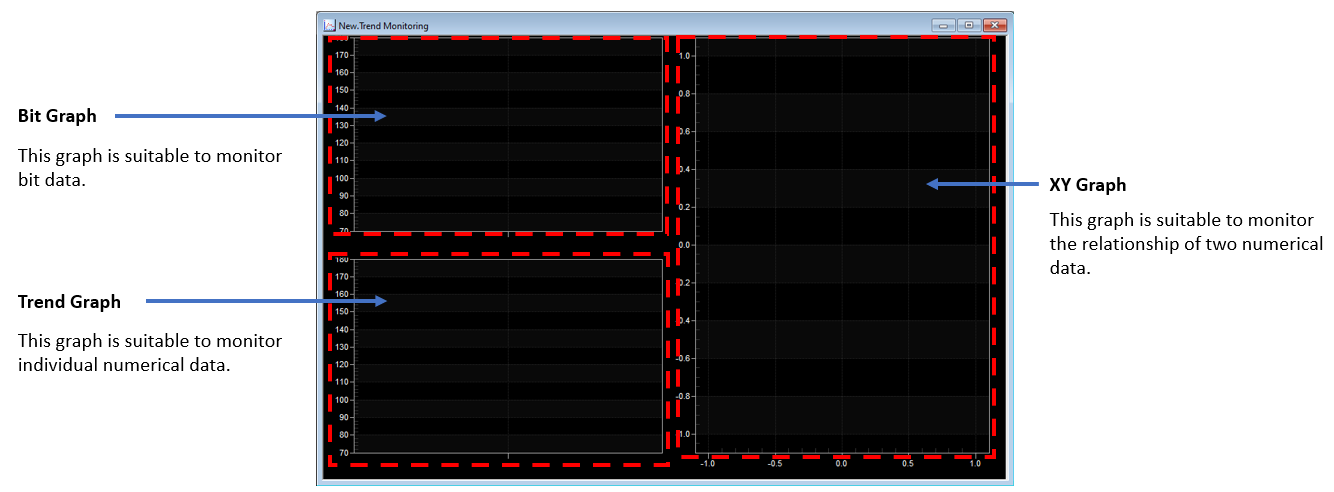
The Trend Monitoring window has 3 sections to monitor different types of data.
Start Trending of Data
To Start trending data in the Trend Window, the XG-PM project must have started monitoring and be online with the CPU.
With the Trend Monitoring window open, select Monitoring menu è Start Monitoring.
Stop Trending of Data
To stop trending data in the Trend window, the XG-PM project must stop monitoring.
With the Trend Monitoring window open, select Monitoring menu è Stop Monitoring.
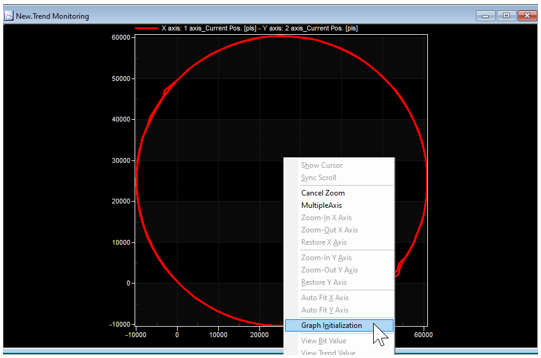
Trend Graph initialization is used to delete all data in a trend.
| Step | Action |
|---|---|
| 1 |
Right-click in the Trend Monitoring window and select Graph Initialization.
|
| 2 |
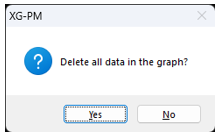
Press Yes to delete graph data.
All data will be deleted.
|
XG-PM Trend Monitoring has a zoom feature that allows a user to zoom in on a portion of the trend. The zoom can also be canceled to see all the data.
| Step | Action |
|---|---|
| 1 |
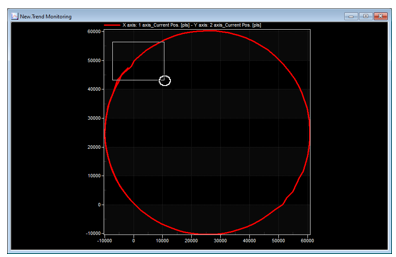
Click the left mouse button in the Trend Monitoring window and drag the selection box over the section to zoom in on.
|
| 2 |
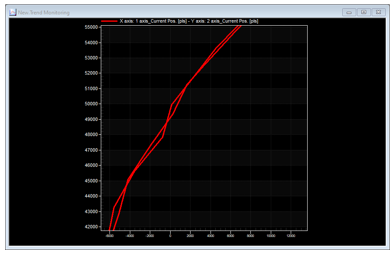
The Trend will zoom in on the area selected.
|
To cancel the zoom, follow the steps below:
| Step | Action |
|---|---|
| 1 |
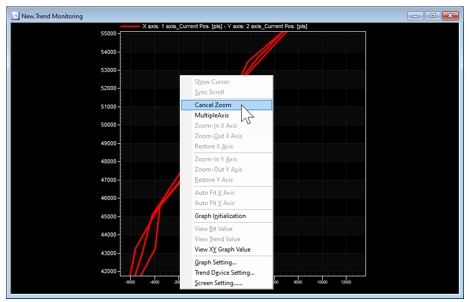
Click the right mouse button in the Trend Monitoring window and select Cancel Zoom.
|
| 2 |
The Trend will display all the data.
|
Trend Data values from the graph can be seen using the cursor and enabling the View Graph data setting for the trend being used.
| Step | Action |
|---|---|
| 1 |
Stop Monitoring to stop the gathering of new trend data.
|
| 2 |
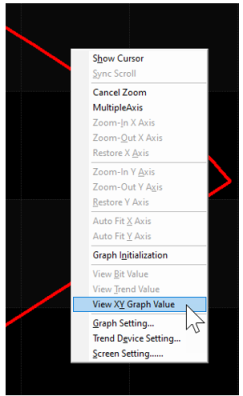
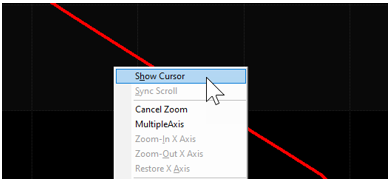
Right-click on the graph. Select the appropriate option for the graph type:
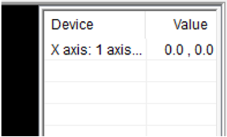
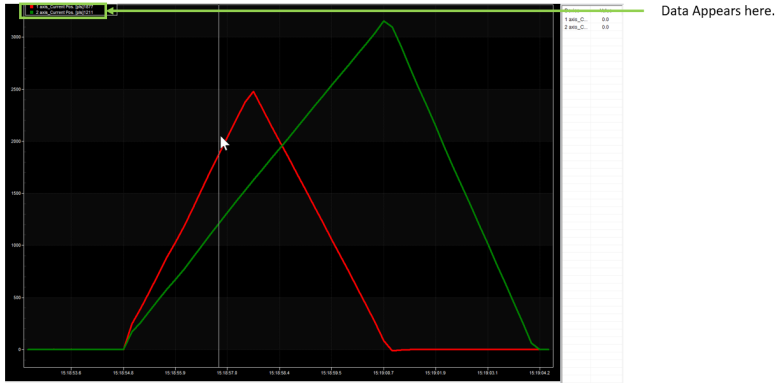
A value table will appear on the right side of the Graph.
|
| 3 |
To start viewing data, right-click on the graph and select Show Cursor.
|
| 4 |
Left-click on a section of the graph to see the data by the white cursor line.
|
You can view two examples of EtherCAT trend monitoring in the How to Monitor Motion Control with the Trend Monitoring Window topic.
LP610