PID Faceplate Trend Graph Object — Data Tab |
CM096 |
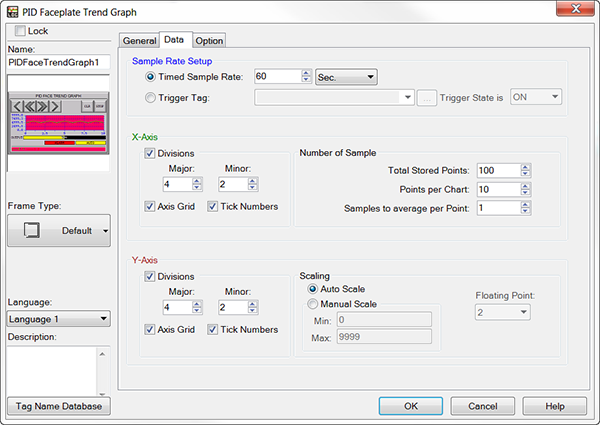
The Data Tab of the PID Faceplate Trend Graph Object set-up window enables the user to enter and edit settings that affect the look and operation of the PID Faceplate Trend Graph.

Set Up the Data Tab
The figure above shows the PID Faceplate Trend Graph Data Tab set-up window.
-
Complete the fields on the screen common to all objects using the information in the Working with Objects Help topic.
-
Complete the remaining fields on the screen using the information in the table below.
| PID Faceplate Trend Graph Window | |
|---|---|
| Field | Description |
| Sample Rate Setup | The interval at which each Data point is saved. |
| Sample Interval | A Data point will be plotted at the Sample interval rate. For the default, a point will be plotted every 60 seconds. |
| Trigger Tag | A Data point will be plotted whenever the Trigger Tag (a discrete tag selected from the Tag Name Database) comes ON or goes OFF depending on the Trigger State setting. The Trigger Tag maximum cycle rate is 1 second. |
| Trigger State is | When Trigger Tag is selected, this plots a Data point when the Trigger comes ON or when the Trigger Tag goes OFF. |
| X-Axis and Y-Axis | Click on the X-Axis and/or Y-Axis Division check boxes to select them. When selected, the settings for each respective Axis will become active. |
| Divisions | Add tick marks, tick numbers and grid lines to the chart area. Major - Major divisions have a tick mark, tick number, and grid line. Minor - Minor divisions only have tick marks. |
| Axis Grid | Display Grid lines in the chart area corresponding to the Major divisions. |
| Tick Numbers | Display tick numbers on axis corresponding to the Major divisions. |
| Points Per Chart | The number of points that to display (from 4 - 99) at one time on the chart. |
| Total Stored Points | The total number of Data points (from 10 to 65535) that can be seen on the chart. If the number is greater than the Points per chart, you can scroll back to see historical points. |
| Samples to Average per Point | To smooth out large swings in the values of the Data points, you may average from 1 to 255 points. |
| Auto Scale | When Auto Scale is selected, the Y-Axis upper and lower limits will adjust to what is visible on the trend graph. |
| Manual Scale | When Manual Scale is selected, the Trend Graph will be upper and lower limits and will be fixed to the Min and Max values entered. |
