|
|
Topic: P075 |
Bit Histogram |
|
|
|
Topic: P075 |
Bit Histogram |
|
The Bit Histogram monitors and charts the status of Boolean Tags (bits). Bit Histogram can collect 2,000 samples of up to six tags as often as once per scan. The samples are collected in the CPU and later retrieved for display in the Bit Histogram chart.
The following are the minimum steps to get data in the Bit Histogram chart:
There are three methods of accessing Bit Histogram:
Method 1
Use the Bit Histogram Icon
located on the Monitor Toolbar.
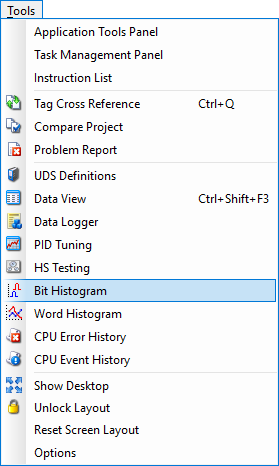
Method 2
Select the Bit Histogram menu item from the Tools Menu, located on the Main Menu and shown to the right.
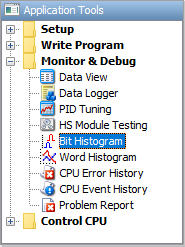
Method 3
Select the Bit Histogram item from Monitor and Debug topic of the Application Tools panel.
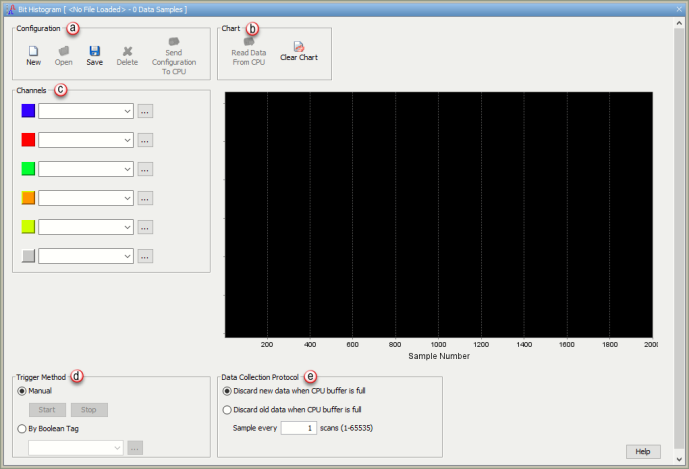
Once selected, a Bit Histogram window will open as shown below.
Note: The Chart shown in this window has a Zoom feature that allows you to get a closer view of a selected region in the Chart. For more information see the Chart Zoom Feature subject at the bottom of this topic.
The Bit Histogram window provides the following:
- New: Select New to clear all fields of the Bit Histogram window and begin a new configuration.
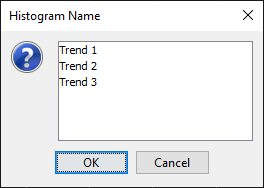
- Open: Select Open to display the Histogram Name window where existing Histogram Configurations can be accessed. Select the desired file and click OK.
- Save: Select Save to store the Configuration of a new Histogram file. Once the configuration data has been saved, the following Save Histogram window will appear reminding the user that the project needs to be saved as well.
- Delete:Select Delete to display the Histogram Name window (shown above) where histogram files can be accessed for deletion. Highlight the desired file(s) for delete and select OK.
- Send Configuration to CPU: Select Send Configuration to CPU to send the selected Histogram file to the connected CPU>. If there is no communication with a CPU, the Send Configuration to CPU selection will be disabled.
- Read Data From CPU: Select Read Data From CPU to retrieve data to be displayed on the chart. This will also clear the CPU buffer.
- Clear Chart: Select Clear Chart to remove data from the chart.
- Manual: Select the Manual method to Manually Start and Stop the data gathering process.
- By Boolean Tag: Select the Boolean Tag method to use a tag to Enable gathering data for the chart. After the Logic Scan, data for Channel Tags is saved to the CPU Buffer if this Tag is ON and the Collection Protocol conditions are met. Use the down arrow
to display a list of available tags or use the tag browse button
to open the Tag Picker window for selection.
- Discard new data when CPU buffer is full: Once the CPU Buffer is full (2000 samples), additional triggering will no longer add new data to the Buffer.
- Discard old data when CPU buffer is full: Once the CPU Buffer is full (2000samples), the oldest data is discarded as new data is added.
- Sample every _____ scans: Determines how often to save data to the CPU Buffer. When set to 1, Channel Tag data is added to the CPU Buffer on each scan that the trigger condition is met. When set to 2, Channel Tag data is added to the CPU Buffer every second scan that the trigger condition is met.
For example, if the Trigger Method is set to By Boolean Tag, the Every Other Scan Bit is selected from the drop down list (Trigger condition would be True every other scan) and Sample Every was set to 4, the Channel Tag data would be added to the CPU Buffer once every 8 scans.
The Chart Zoom Feature allows you to get a closer view of a selected region once that region is highlighted. From the Bit Histogram window, select a portion of the Chart by clicking on the Chart and dragging the mouse down and right as shown below.
The Chart Zooms to the highlighted area and displays the chart as shown below.
Note: Click and drag the mouse from top left to bottom right as many times as needed to zoom to the appropriate magnification. Click and drag mouse from bottom right to top left to return to the original view.