Using XY Graph Example
Follow the steps below to set up trend monitoring with an XY graph.
| Step | Action |
|---|---|
| 1 | Open XG5000 project and connect to the PLC. |
| 2 |
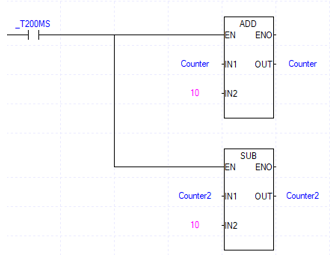
Add the ladder code below to a program. This example shows a program called “NewProgram”. Counter and Counter2 are local DINT variables.
|
| 3 | Save the project and write it to the XMC CPU. |
| 4 |
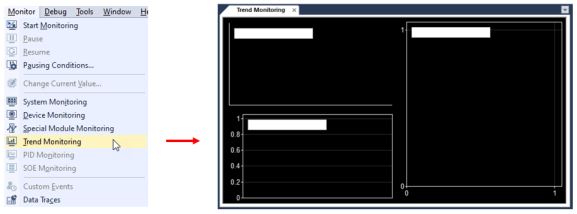
Select Trend Monitoring from the pull-down menu Monitor.
|
| 5 |
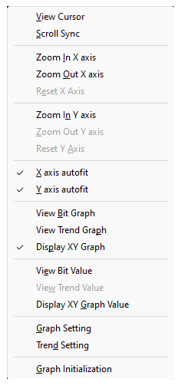
Right-click on the trend and ensure only XY Graph is selected.
|
| 6 |
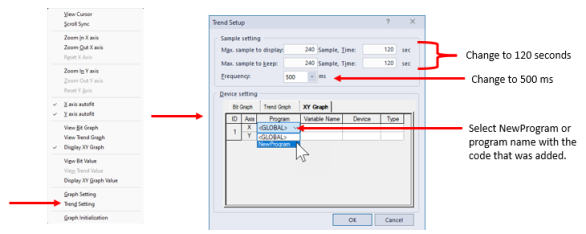
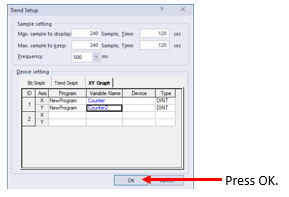
Open the Trend Setup window in the right-click menu. Set the Frequency to 500ms and Sample Times to 120 seconds. Then in the XY Graph tab select New Program in the Program column for X and Y.
|
| 7 |
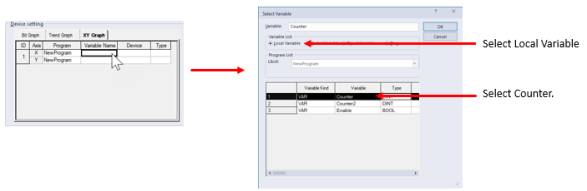
Double-click in the Variable Name column for X axis to select the Counter variable.
|
| 8 |
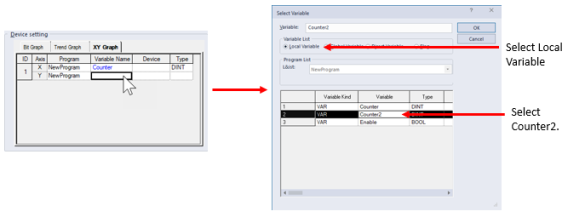
Double-click in the Variable Name column for Y axis to select the Counter2 variable.
Press OK when done.
|
| 9 |
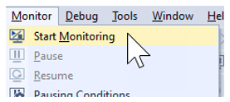
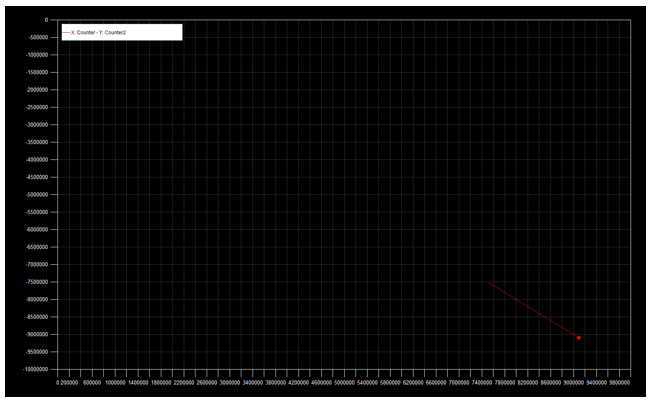
Start Monitoring mode to record XY Graph data.
Data will start recording.
|
LM125-5