EtherNet/IP Status, Monitor, and Troublshooting
The XEM CPU provides system diagnostic options for the XBL-EIPT.
-
LS Electric uses the terms Client and Server for Implicit Communication. The industry standard terms are Adapter and Scanner.
-
The Implicit server refers to an EtherNet/IP Adapter and Implicit Client refers to an EtherNet/IP Scanner.
System Diagnosis Screen
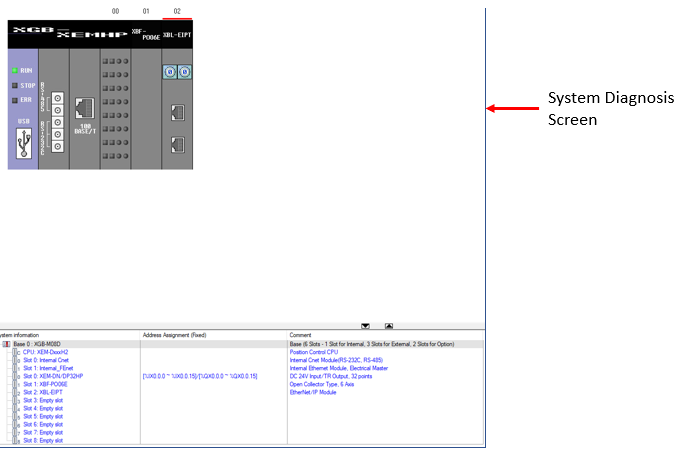
The System Diagnosis screen is used to check the state of the EtherNet/IP I/F module and systems.
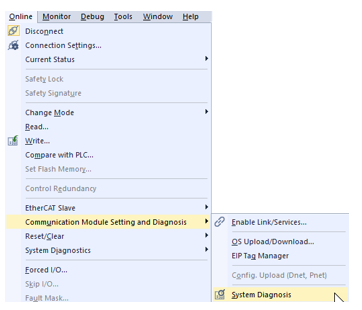
To get to the System Diagnosis screen, select Online è Communication Module Setting and Diagnosis è System Diagnosis.
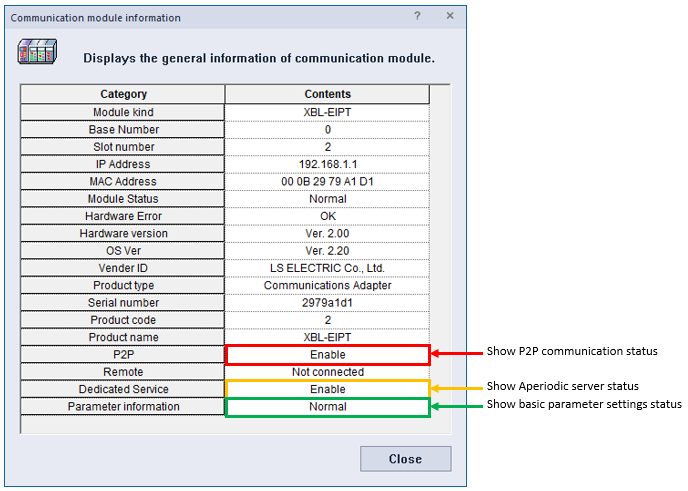
The Communication module information screen will give the user information about the XBL-EIPT module that is installed in the XGB PLC rack.
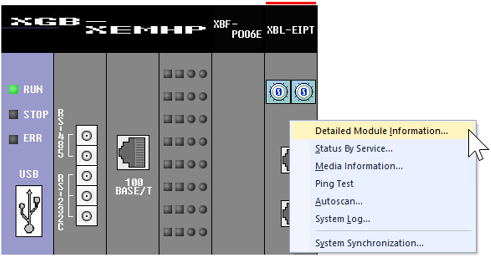
Right-click on the XBL-EIPT in the System Diagnosis Screen and select Detailed Module Information…
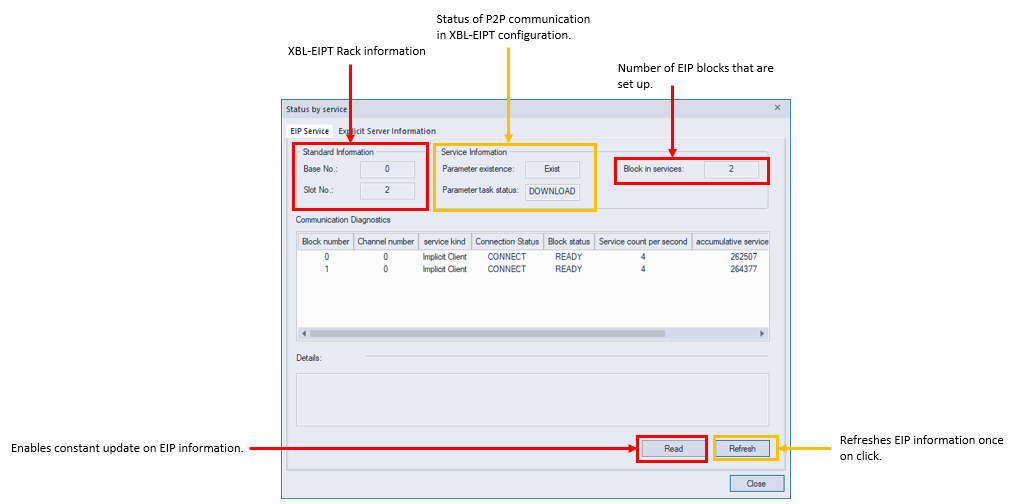
The Status by Service screen will give the user information about the EtherNet/IP services that are running. EIP Service tab shows information about EtherNet/IP Scanner (Implicit Client), EtherNet/IP Adapter (Implicit Server), and Explicit Client.
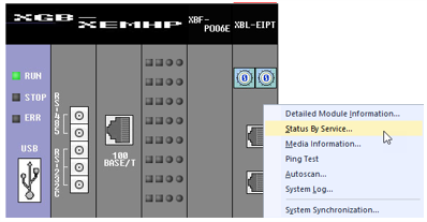
Right-click on the XBL-EIPT in the System Diagnosis Screen and select Status By Service…
| Function | Description |
|---|---|
| Block Number | Displays the block number of the EIP service set up by the user. |
| Channel Number | Displays the channel number used by the EIP service. |
| Service Kind | Displays type of service the block uses such as EtherNet/IP Scanner (Implicit Client), EtherNet/IP Adapter (Implicit Server) or Explicit Client. |
| Connection Status | Displays the EIP block connection status. CONNECT shows connection has completed. IDLE shows the connection has not completed. |
| Block Status |
|
| Service Count per Second | Displays how many times the service has been carried out per 1 second. |
| Accumulative Service Count | Displays number of packets sent for the EIP service. |
| Accumulative Error Count | Displays number of errors for the EIP service. |
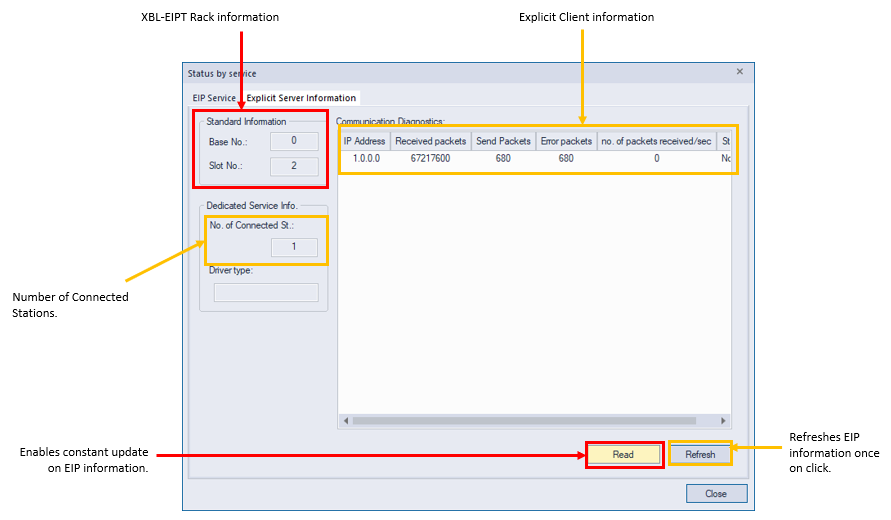
The Status by Service screen will give the user information about the EtherNet/IP services that are running.
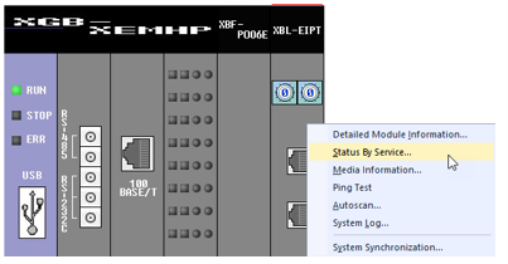
Right-click on the XBL-EIPT in the System Diagnosis Screen and select Status By Service…
| Function | Description |
|---|---|
| IP Address | IP address of connected client. |
| Received packets | The number of transmission packets received from clients. |
| Send packets | The number of transmission packets sent to clients. |
| Error packets | The number of error packets coming into a server. |
| Number of packets received/sec | The number of reception packets received per second. |
| Status | Explicit server status. |
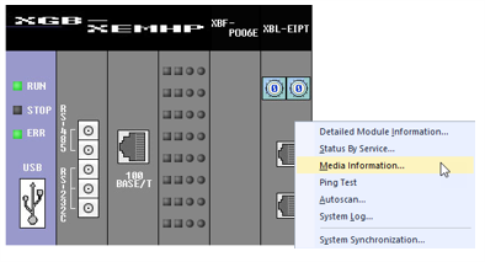
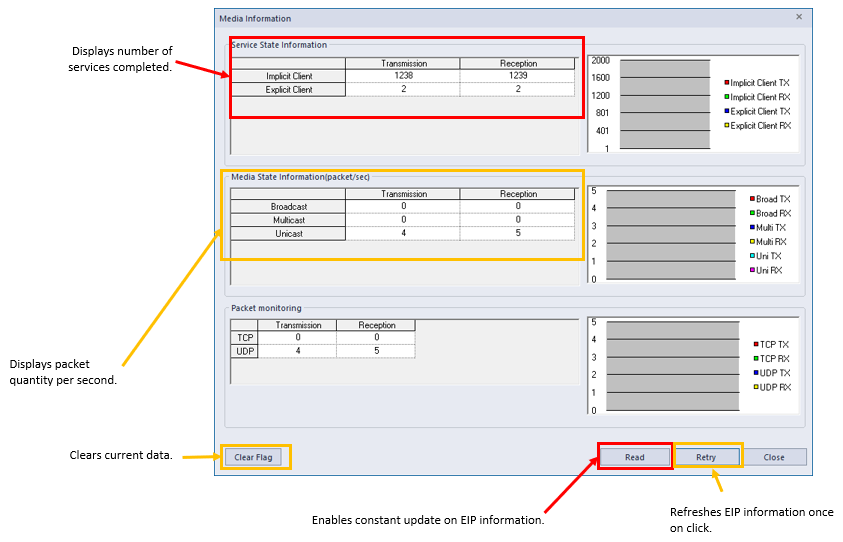
The Media Information screen displays network traffic statistics.
Right-click on the XBL-EIPT in the System Diagnosis Screen and select Media Information…
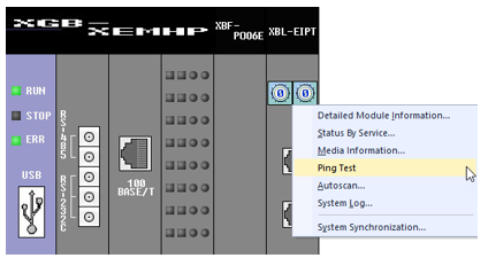
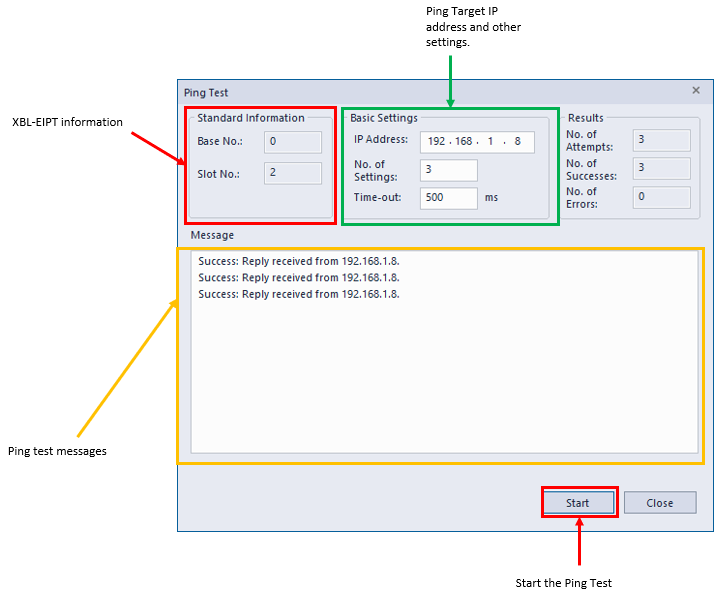
The Ping Test screen will allow the user to ping a device on the EtherNet/IP network.
Right-click on the XBL-EIPT in the System Diagnosis Screen and select Ping Test.
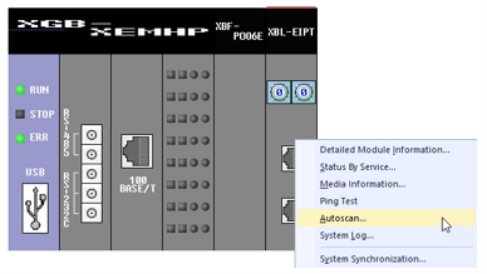
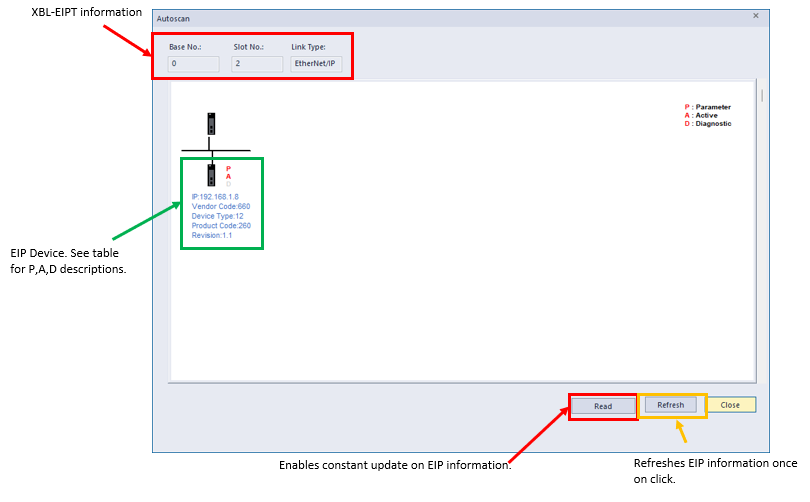
Auto-Scan will map out the EtherNet/IP network of the XBL-EIPT module.
Right-click on the XBL-EIPT in the System Diagnosis Screen and select Autoscan…
| Function | Description |
|---|---|
| P | Parameter: if highlighted shows that EIP parameters are set up. |
| A | Active: if highlighted shows that the module is operating normally. |
| D | Diagnostic: if highlighted shows that the module has an error. |
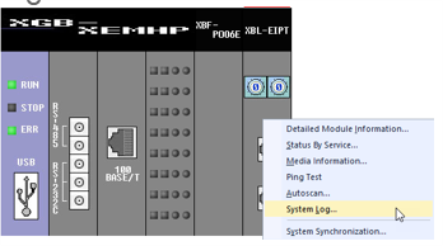
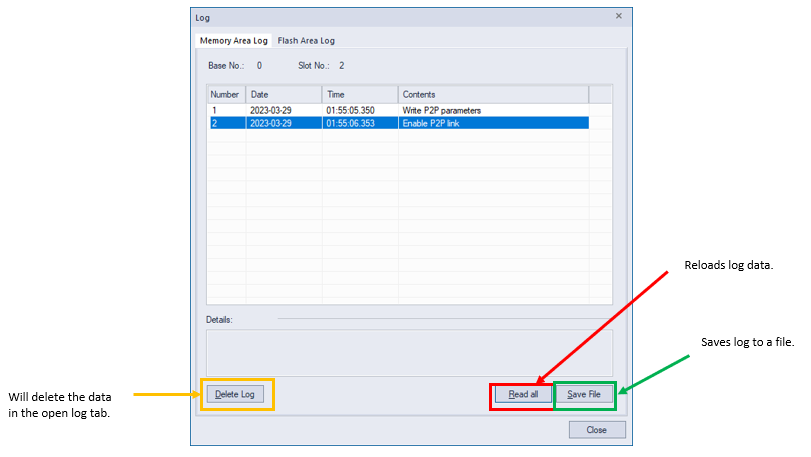
System log stores event messages of the XBL-EIPT module. Memory Area log tab shows current messages. Flash Area log tab will show the messages copied from the Memory Area when the LOG button on the XBL-EIPT is pressed. The Memory Area log will be erased when power is turned off. Flash Area log will be maintained when power is turned off.
Right-click on the XBL-EIPT in the System Diagnosis Screen and select System Log…
Troubleshooting
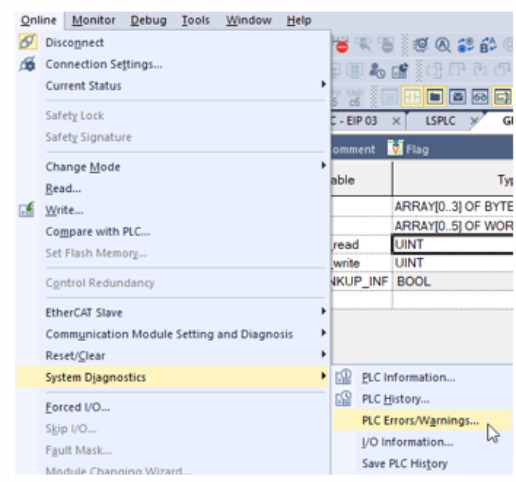
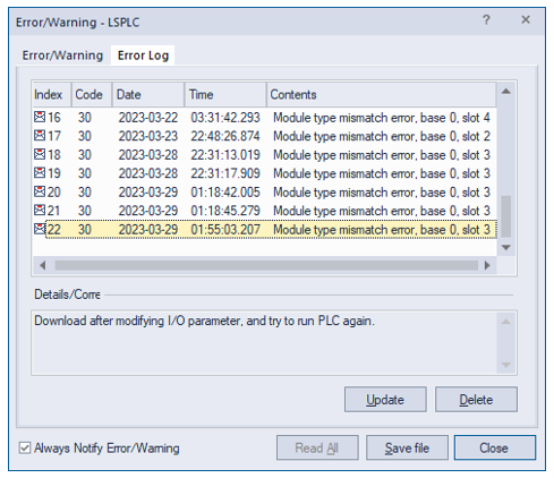
XG5000 displays module errors in the Error/Warning logs. This can be accessed in Online è System Diagnostics è PLC Errors/Warnings…
LP200A