Line Trend Graph — Pen |
Topic: CM318 |
Pen Tab Configure Window
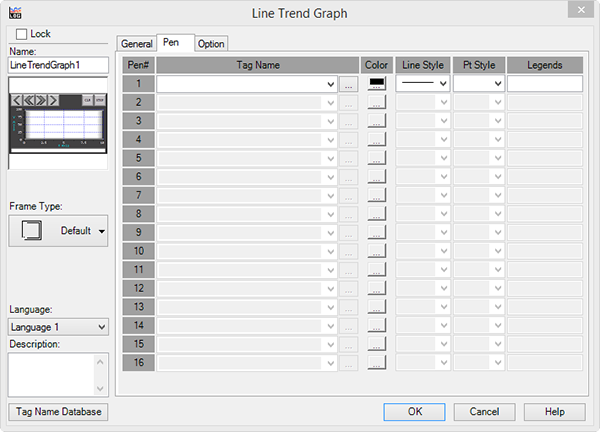
The Pen tab allows the user to enter and edit Pens that will be used to chart the Tag Names assigned to the Line Trend Graph. Click on the fields described below to set up each Pen. A total of 16 Pens may be added to this Object for monitoring.
- When you select Pen Tab, the setup window shown below opens.

Configure the Pen Tab
The Pen Tab window offers the following configuration features:
| Pen Tab | |
|---|---|
| Field | Description |
| Tag Name | Click on the down arrow to the right of the Tag Name field and select an existing Tag Name. Clicking on the Browser button to the right of the Tag Name field opens the Tag Name Database for this project. From this Database you may select a Tag Name and add or edit a Tag. |
| Color | Click on the Color box to open a Color Palette of available color choices for the Pens. Remember to pick different colors for each Pen to prevent reading confusion. |
| Line Style | Lines are an interpolation between Data Points but do not represent real data. Use Point Markers to show real data. Click on the down arrow to select the desired Line Style. |
| Pt Style | Point Markers show the specific X and Y axis location of the Data points. Click on the down arrow to select the desired Point Style. |
| Legends | Enter up to 16 characters that describe the pen. This text will appear in the Legend configured in the General tab. |
