Trend Graph Options |
Topic: CM298 |
The information included in this topic applies to the following objects:
- Line Trend Graph
- PID Faceplate Trend Graph

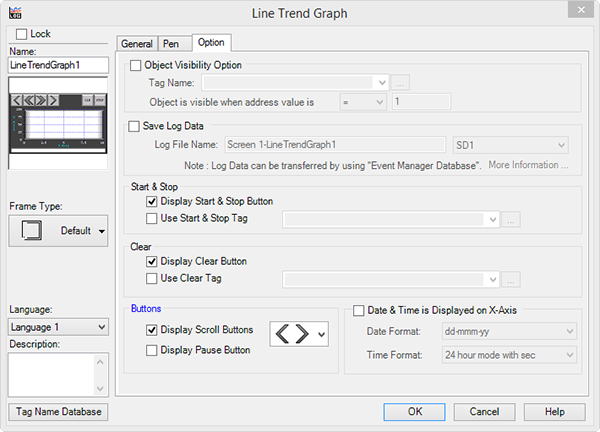
Set Up the Object Visibility Option
Object Visibility Option
The Visibility Option allows you to show or hide the object based on the value of a Tag.
Tag Name
Select a Tag Name that will control the visibility of the object.
Object is Visible When Address value is
Click on the down arrow to the right of the field to select the proper operand that makes the value on the field to the right true. When this value is met, the Object becomes visible.
Data Logging
As an option in the Line Trend Graph and PID Faceplate Trend Graph, you may select to have the Data Points saved to a Data Log to one of the External Memory Devices which may be retrieved for analysis in another application.
Log File Name
The Log File Name field fills automatically with the combined Screen Number and the Object Name together. Edit the Screen and Object Names to use something else.
Selecting Memory Device
When Save Log Data is selected, you may select the memory device where this file will be saved. The choices are:

The following are Data Logging Log File quantities C-more HMI Program/Panels allow.
Data Logging File Quantities
- Maximum Number of Logging Files: 18 Log File / Panel
- Trend Graph/PID Trend Log Data: 16 Log File / Panel Max subject to storage maximums. Refer to Runtime Errors topic
- Alarm Message Log: 1 Log File / Panel
- Message DB Log: 1 Log File / Panel
- Message Database / Look up Text Object
- Multi-state Text Object
When does SRAM buffer write to the SD or USB Flash?
- The SRAM buffer (2KB) is full or after 20 Records
- 1 minute has passed since last transfer to flash device
- The Event Manager sends a Log File via FTP or Email
- The following System Tags are turned ON:
- SYS Copy LogTo%Device% - %Device% = SD1, USB 1, 2, or 3
- SYS %Device% Eject - %Device% = SD1, USB 1, 2, or 3
- The device calls the System Screen
- When the panel is powered-up, Line Trend and PID Trend Log Data in SRAM (backed up by battery) is stored to %Device% - %Device% = SD1 or USB, 1, 2 or 3.
|
|
Note: All SRAM Data, *.log Files and *.txt Files in the panel, will be cleared when a project is transferred to the panel. |
Set Up the Start & Stop Feature
Display a Start and Stop Button
Tick this box to display a Start and Stop button. Stop causes the display to stop scrolling AND Data will not be posted to the Graph Object. When you press Start, Data missed during the Stop period does not display.
Use Start and Stop Tag
To assign a Tag Name that will control the Start and Stop, tick the Use Start & Stop Tag box. Click on the down arrow to the right of the Tag Name field and select an existing Tag Name to assign.
Set Up the Clear Feature
Use the Clear button to clear all Data from the displayed trend and start over. It does not clear Data from the Data log.
Display Clear Button
To display the Clear button on the Trend Object, tick the Display Clear Button box.
Use Clear Tag
To assign a Tag Name that will control when the currently displayed Data will be cleared, click on the Use Clear Tag button.
To select an existing Tag Name to assign, click on the down arrow to the right of the Tag Name field. The Tag Name database opens displaying existing Tag Names for this project.
Set Up Trend Display Buttons
Optional Scroll and Pause buttons can be configured for the Trend objects.
Pause
The Pause button allows the user to temporarily pause the Trend Data Graph. This is useful to view specific Data information and be able to make notes of the Data being displayed without losing the Data as it travels on the Trend Graph. Data continues to post to the Graph Object and will display with the graph is resumed.
Use the arrows to scroll the Graph window to its current point or to search for another Data Point to view. The Single arrow moves to the next point in the direction of the arrow. The double arrow moves the Graph to the Last Point (right arrow) or to the First Point (left arrow).
Set Up the Date and Time Display On The X-Axis
Determines if the date and time will be displayed on the X-axis of the Trend Data Screen. To display the date and time, click on the Date & Time is Displayed on X-axis check box.
When you select the Date format or Time Format, these features are activated and allow you to change the settings. Click on the down arrow for the Date Format and select from the choices of date formats in the table below:
| Option Tab: Date and Time Display on the X-Axis | |
|---|---|
| Field | Description |
| dd-mmm-yy | Displays the Day (01 to 31), the first three letters of the Month, and the last two digits of the Year (i.e., 16-May-09). |
| dd-mm-yy | Displays the Day (01 to 31), the two digits representing the Month (01 to 12), and the last two digits of the Year (i.e., 16-05-09). |
| mm-dd-yy | Displays the Month (01 to 12), the two digits representing the Day (01 to 31), and the last two digits of the Year (i.e., 05-16-09). |
| yy-mm-dd | Displays the last two digits of the Year, the two digits representing the Month (01 to 12), and the Day (01 to 31) (i.e., 09-05-16). |
Click on the down arrow for the Time Format and select from the Time Format choices in the table below:
| Option Tab: Time Formats | |
|---|---|
| Field | Description |
| 12 hour mode without sec | Displays the Hours in 12 Hour mode (01 to 12) with the Minutes. No Seconds are displayed. (i.e., 03:45). |
| 12 hour mode with sec | Displays the Hours in 12 Hour mode (01 to 12) with the Minutes and Seconds displayed. (i.e., 03:45:10). |
| 24 hour mode without sec | Displays the Hours in 24 Hour mode (01 to 24) with the Minutes. No Seconds are displayed. (i.e., 15:45). |
| 24 hour mode with sec | Displays the Hours in 24 Hour mode (01 to 24) with the Minutes and Seconds displayed. (i.e., 15:45:10) |
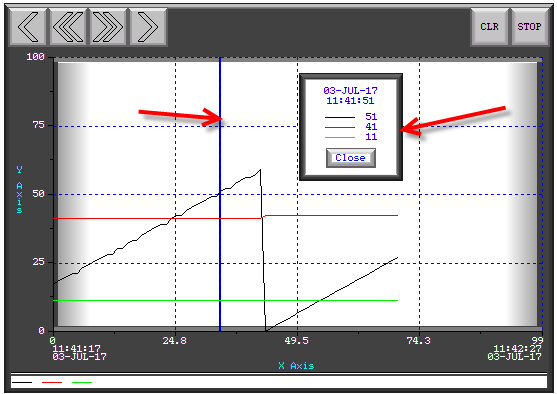
When you select Date&Time, when you touch a Data point, a cursor line displays. A small Data window opens providing the information for the selected Data Point.

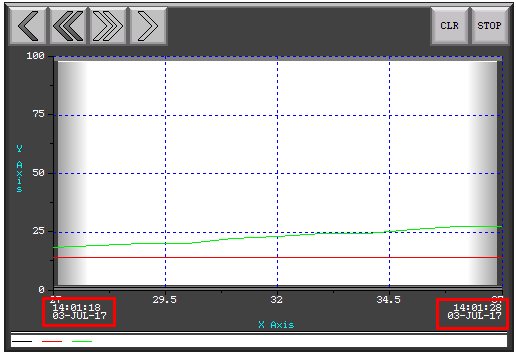
When you select Date&Time Displayed on the X-Axis, the Trend Graph displays the date and time at the beginning and end of the visible portion of the Trend Graph.

